How can we embrace the rising sea and create better lives in an urbanized world? Look here!
The hardest part is not to control the flow of water, but the flow of decisions.
Who will take leadership and legal ownership to the problem?
How can we cross organizational boundaries that reflects the cross-cutting nature of rising waters?
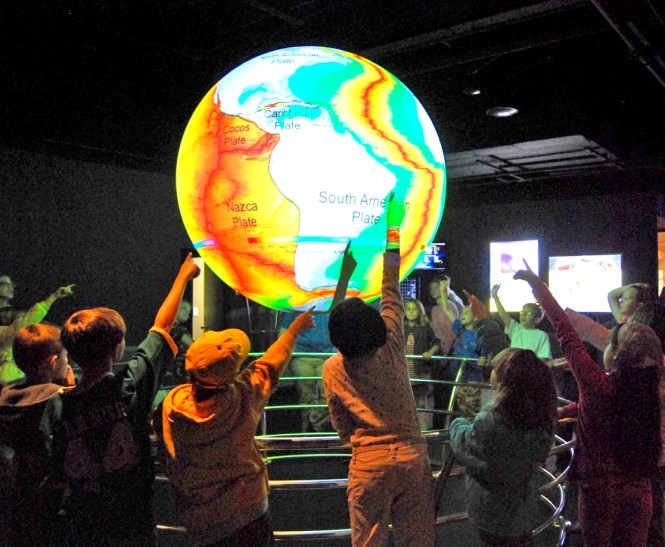
How do we educate the public and involve the students who are inheriting the problem?
What citizen science projects help in a community in a sustainable way?
In the news?
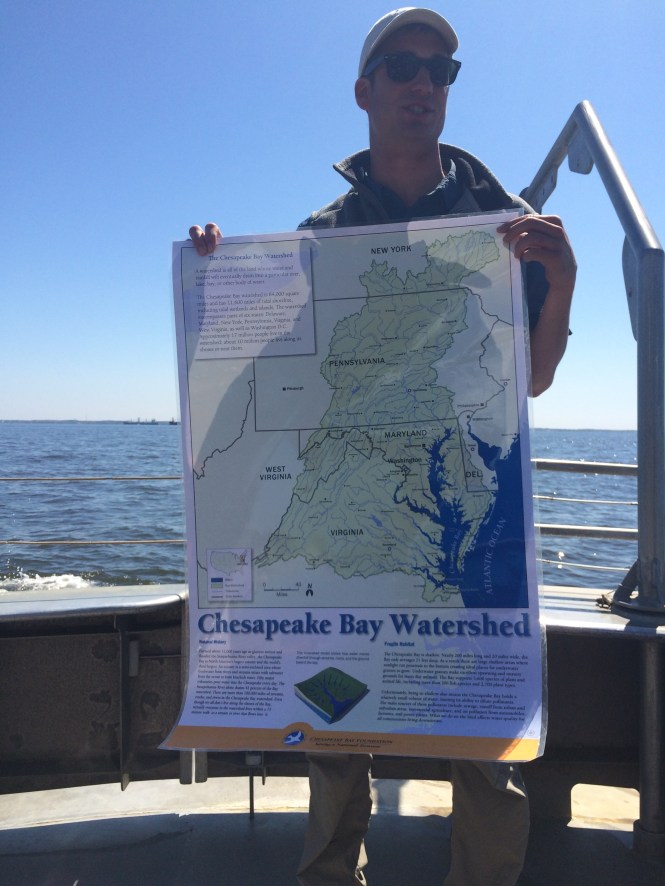
Tangier Island, Virginia
If you stand at the end of the dock in Crisfield, Maryland, and gaze out over the water, you might not catch the tiny shape of a water tower barely visible on the horizon. And when you look at a map you can just as easily miss the tiny island that the tower sits on, 12 miles from either coast in the middle of the Chesapeake Bay. Largely unknown, Tangier Island, Virginia, is one of the most isolated and extraordinary places in the continental U.S.
It’s also in danger of disappearing. In 50 to 100 years, the water tower in the center of town may be all that’s left of the place.
The isolation of the island, an hour-and-a-half ferry ride from the coast, and largely closed off from the rest of the world, makes it unique. Some islanders go years without seeing the mainland, getting the supplies from the trusty mail boat that arrives in the harbor every day, rain or shine.
Tangier, Disappearing Island ( Business Insider, Slate article)
The men on the island, virtually all of whom work as commercial crabbers and oyster fishermen, or “watermen,” pack their catch on a separate boat that makes daily trips to the mainland, further reducing the need to leave.
Just 1.2 square miles in all, Tangier Island is home to more than 500 full-time residents whose families have known one another for decades. “You don’t have to worry about traffic jams and murders, child molesters, rapist, and thieves,” Laird says. “You can leave your doors open. You don’t have to lock anything.
They have something to worry about. Rising Sea levels.

Rising or falling sea level can reshape the world’s coastlines and affect some of the most densely populated areason Earth. Not surprisingly, scientists want to understand sea level as thoroughly as possible. They have discovered that the ocean’s behavior is not uniform all over the world; neither are the factors that affect sea level. When sea level rises, it can do so for a few reasons. It can rise due to thermal expansion—the tendency of warm water to take up more space than cooler water. It can rise due to the addition of water, for instance from melting glaciers. It can also rise due to changes in salinity; fresh water is less dense than salt water and therefore takes up slightly more space than an equal mass of salt water.
Besides understanding the causes of sea level changes, scientist want to accurately gauge the rate of sea level rise. Relying on data from satellites and floats (mechanical devices drifting in the ocean), a group of oceanographers announced in June 2006 that sea level rose, on average, 3 millimeters (0.1 inches) per year between 1993 and 2005. This graph shows the increase in mean sea level, measured in millimeters. Researchers attributed about half of that increase to melting ice and the other half to thermal expansion as the ocean absorbsexcess energy.
To measure sea level, oceanographers at NASA’s Jet Propulsion Laboratory relied on satellite measurements of sea surface height (which increases as temperature increases) taken by TOPEX/Poseidon and later by Jason-1.Complementing the Jason-1 satellite data were temperature and salinity measurements from the Argo float program. By using measurements from a variety of sources, oceanographers can form a clearer picture of the ocean’s behavior in different parts of the world.
Another tool useful in the study of sea level is NASA’s Gravity Recovery and Climate Experiment (GRACE). GRACE precisely measures surface height not only of the world’s ocean, but also the giant bodies of ice that feed it. If ice mass height drops and ocean level rises, GRACE can measure both changes simultaneously. GRACE observations determined that from 2002 to 2005, Antarctic ice lost enough mass to raise global sea level by 1.5 millimeters (0.05 inches).
President George W. Bush long ago, declared June 4-10, 2006, National Oceans Week, encouraging Americans to learn more about the ocean and sustain it for future generations.
The Waters are Rising On NASA’s Shores

acquired 1888 – 2014
This Image of the Day is an excerpt from our feature story: Sea Level Rise Hits Home at NASA.
As the ocean has warmed, polar ice has melted, and porous landmasses have subsided, global mean sea level has risen by 8 inches (20 centimeters) since 1870. For more than 130 years, hundreds of tide gauges have been used to measure sea level around the world; satellite measurements now complement that historical record. What they both show is that the rate of sea level rise is faster now than at any time in the past 2,000 years, and that rate has doubled in the past two decades.
A rise of a few inches over a few decades does not sound like much. But sea level does not rise evenly; it piles up more in some places because of natural wind and current patterns. And turbulence matters. Imagine a bathtub with a child sloshing around in it. Waves can roll up one side and then the other, sometimes splashing over the brim. The higher the flat-water line (sea level), the greater the chance that the water will slosh out of the basin when it is stirred up by storms and winds.
Sea level also matters in a horizontal direction. A rule of thumb is that 1 inch of vertical change in sea level translates into 100 inches of horizontal loss on a flat beach or marsh. In this way, a little bit of sea level rise can translate into a lot of water moving inland when there are storms or abnormally high tides. “Sea level is important because it gradually moves the high-tide line farther up the beach and closer to buildable land,” said John Jaeger, a coastal geologist from the University of Florida. “It also allows storm surges to penetrate farther inland.”

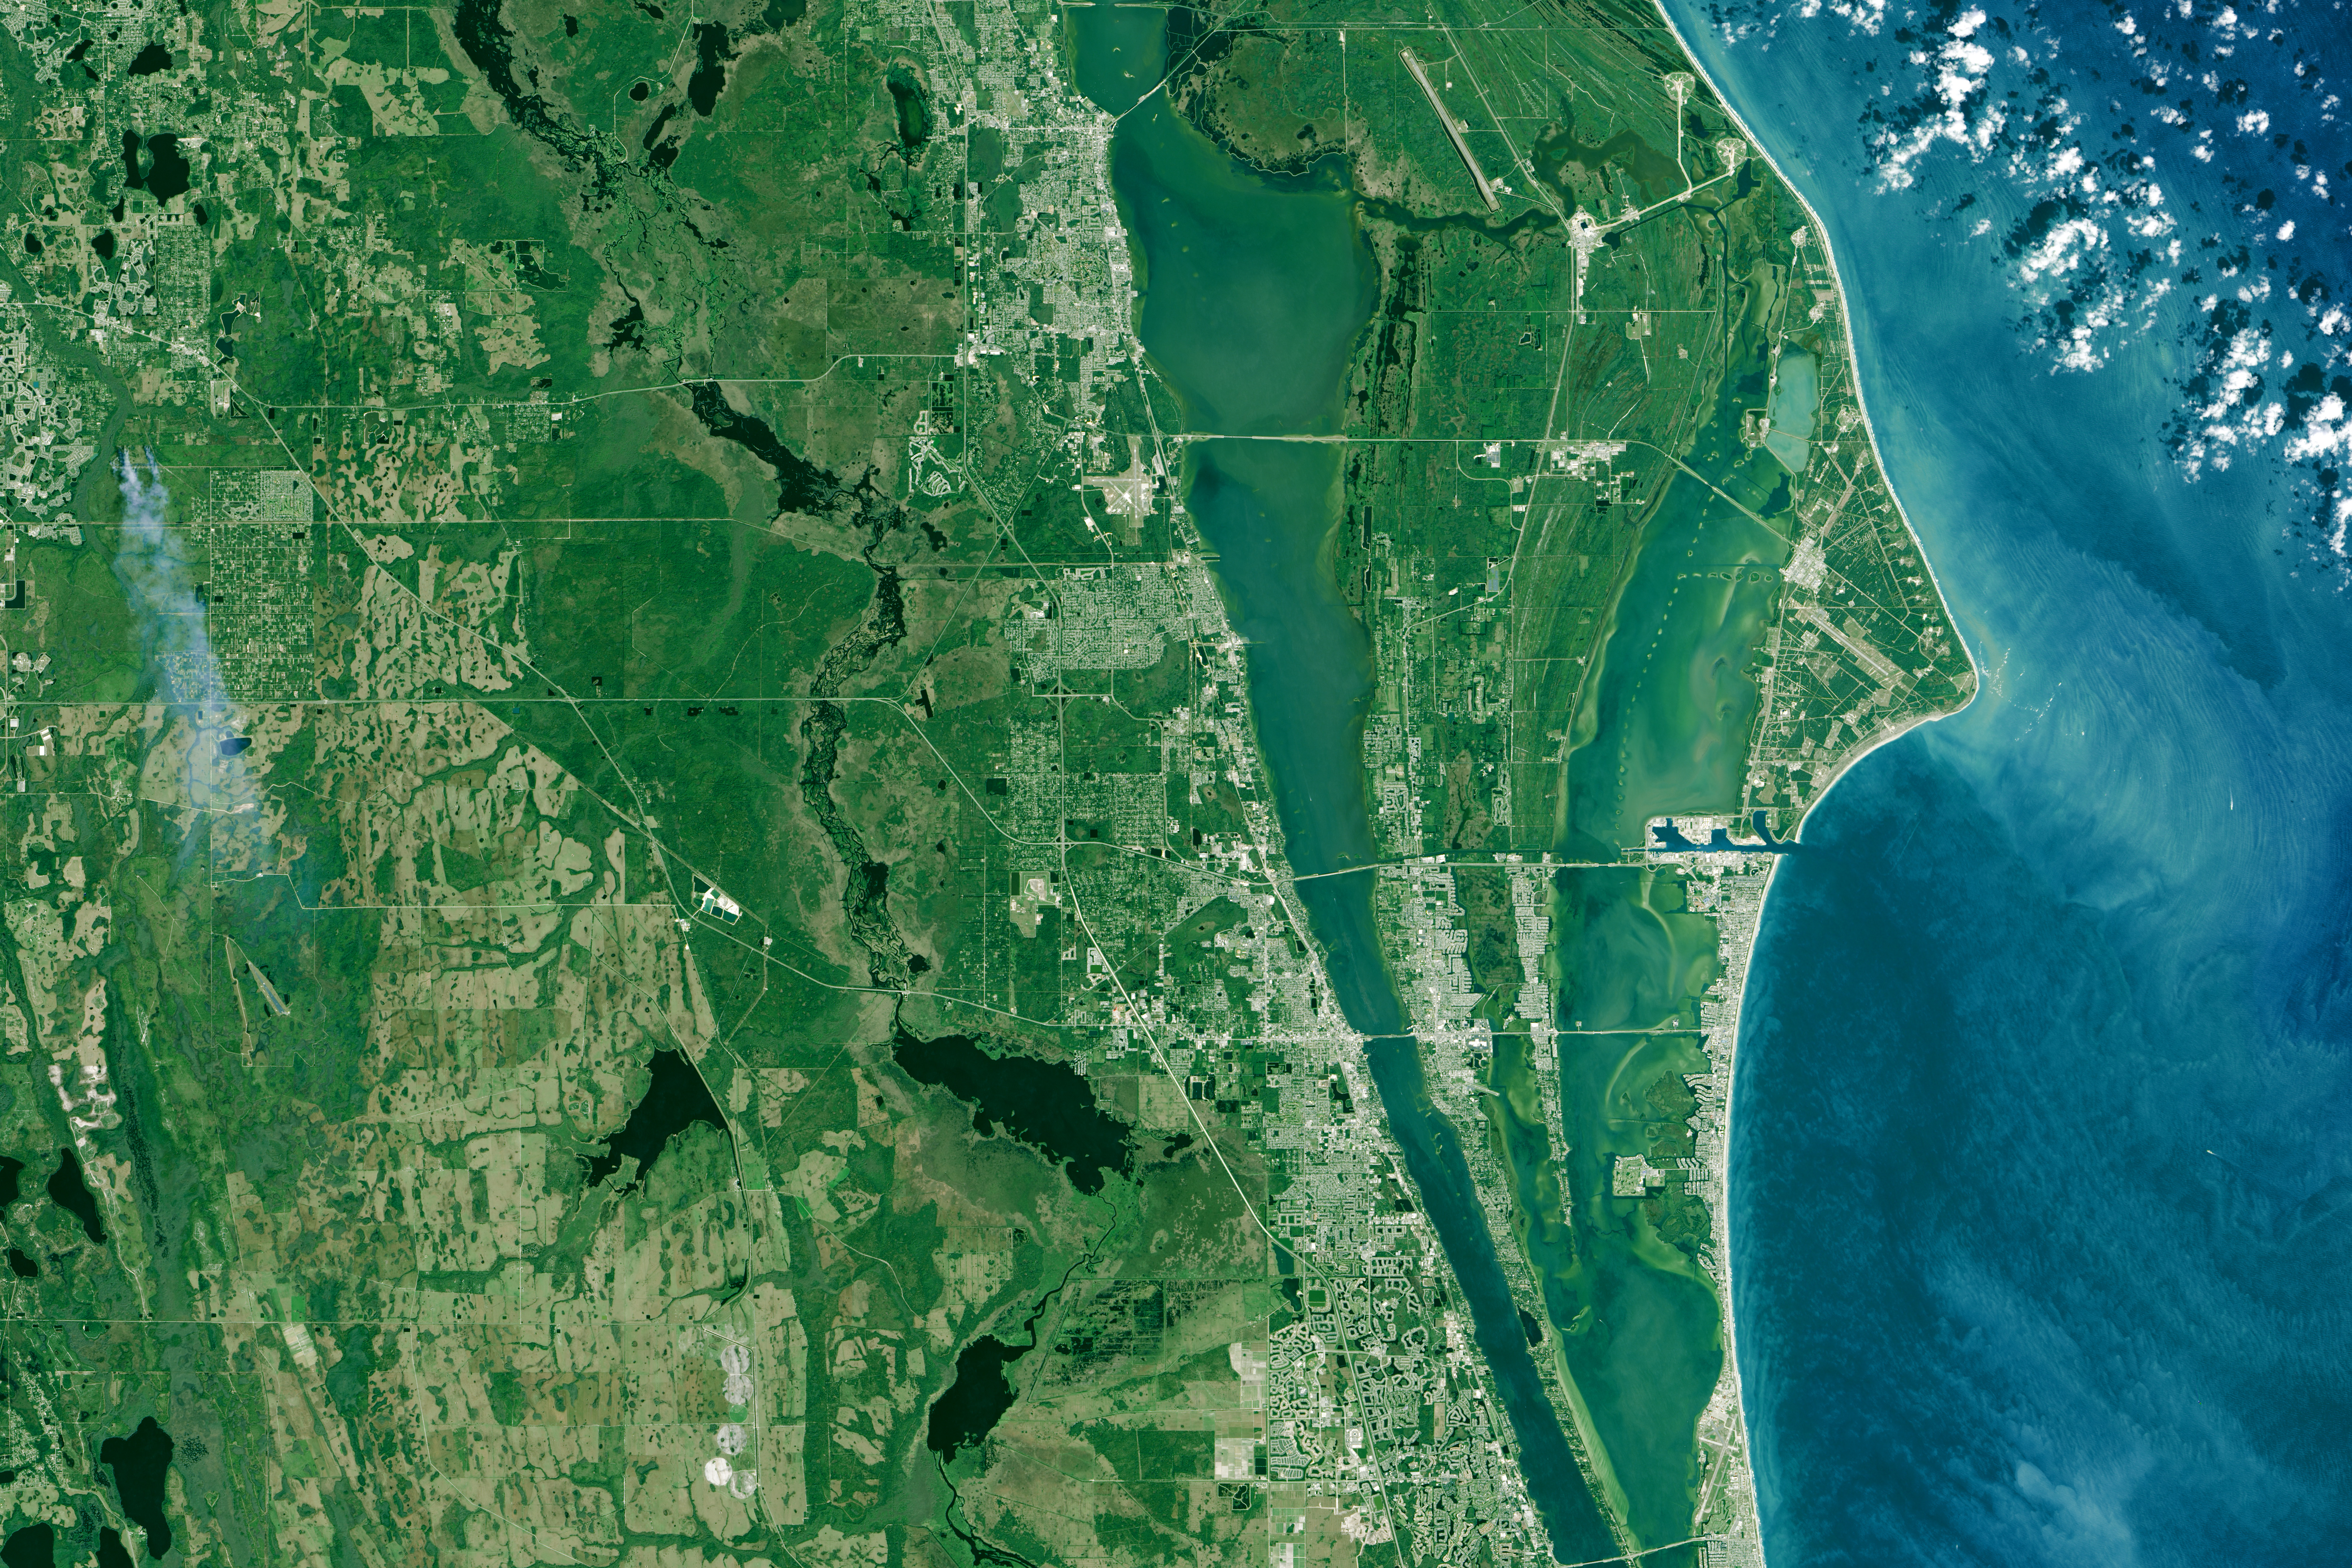
acquired January 28, 2015download large image (9 MB, JPEG, 4950×3300)
The high-tide line has been moving landward for some time at Kennedy Space Center (KSC) in Florida. NASA’s most famous center covers more than 66 square miles (170 square kilometers) and holds about 20 percent of the agency’s constructed assets. Most of KSC is built on coastal marshland that stands about 5 to 10 feet above sea level. Conservative climate models project that the seas off Kennedy will rise 5 to 8 inches by the 2050s, and 9 to 15 inches by the 2080s. If the ice sheets in Greenland and Antarctica continue to melt as quickly as current measurements indicate, those numbers could become 21 to 24 inches by the 2050s and 43 to 49 inches by the 2080s.
“We consider sea-level rise and climate change to be urgent,” said Nancy Bray, spaceport integration and services director for Kennedy.
Based on historical records and aerial photos, the beach in front of Kennedy has thinned and moved inland by as much as 200 feet (60 meters) since the 1940s. The losses have been most acute and persistent along a stretch near the center’s two most prized launch pads, Complex 39A and 39B. The Atlantic Ocean stands less than a quarter mile from both.
In response to the persistent storm damage, Kennedy facilities managers enlisted Jaeger and his University of Florida colleague Pete Adams to figure out why sand dunes near Complexes 39A and B are so persistently being washed away. For five years, Jaeger, Adams, and graduate students pulled GPS mapping gear up and down 6 miles of beach at least once a month—more often in the wake of storms. They found that the beaches were retreating due to the shape of the seafloor just offshore, where gaps between the sandbars channel wave energy toward certain areas. But they also found sand piling up (accreting) in other areas, mostly near Launch Complex 41. The beach is migrating south, even if NASA’s infrastructure is not.
In the aftermath of Hurricane Sandy in 2012, Kennedy Space Center crews piled up 90,000 cubic yards of sand to create a 1.2-mile-long dune. So far, it has provided protection against storm and wave inundation. In the longer run, Bray and colleagues are working on what they call a “managed retreat.” They are building up the shore defenses, while also earmarking land farther inland for additional launch infrastructure should the demand materialize.
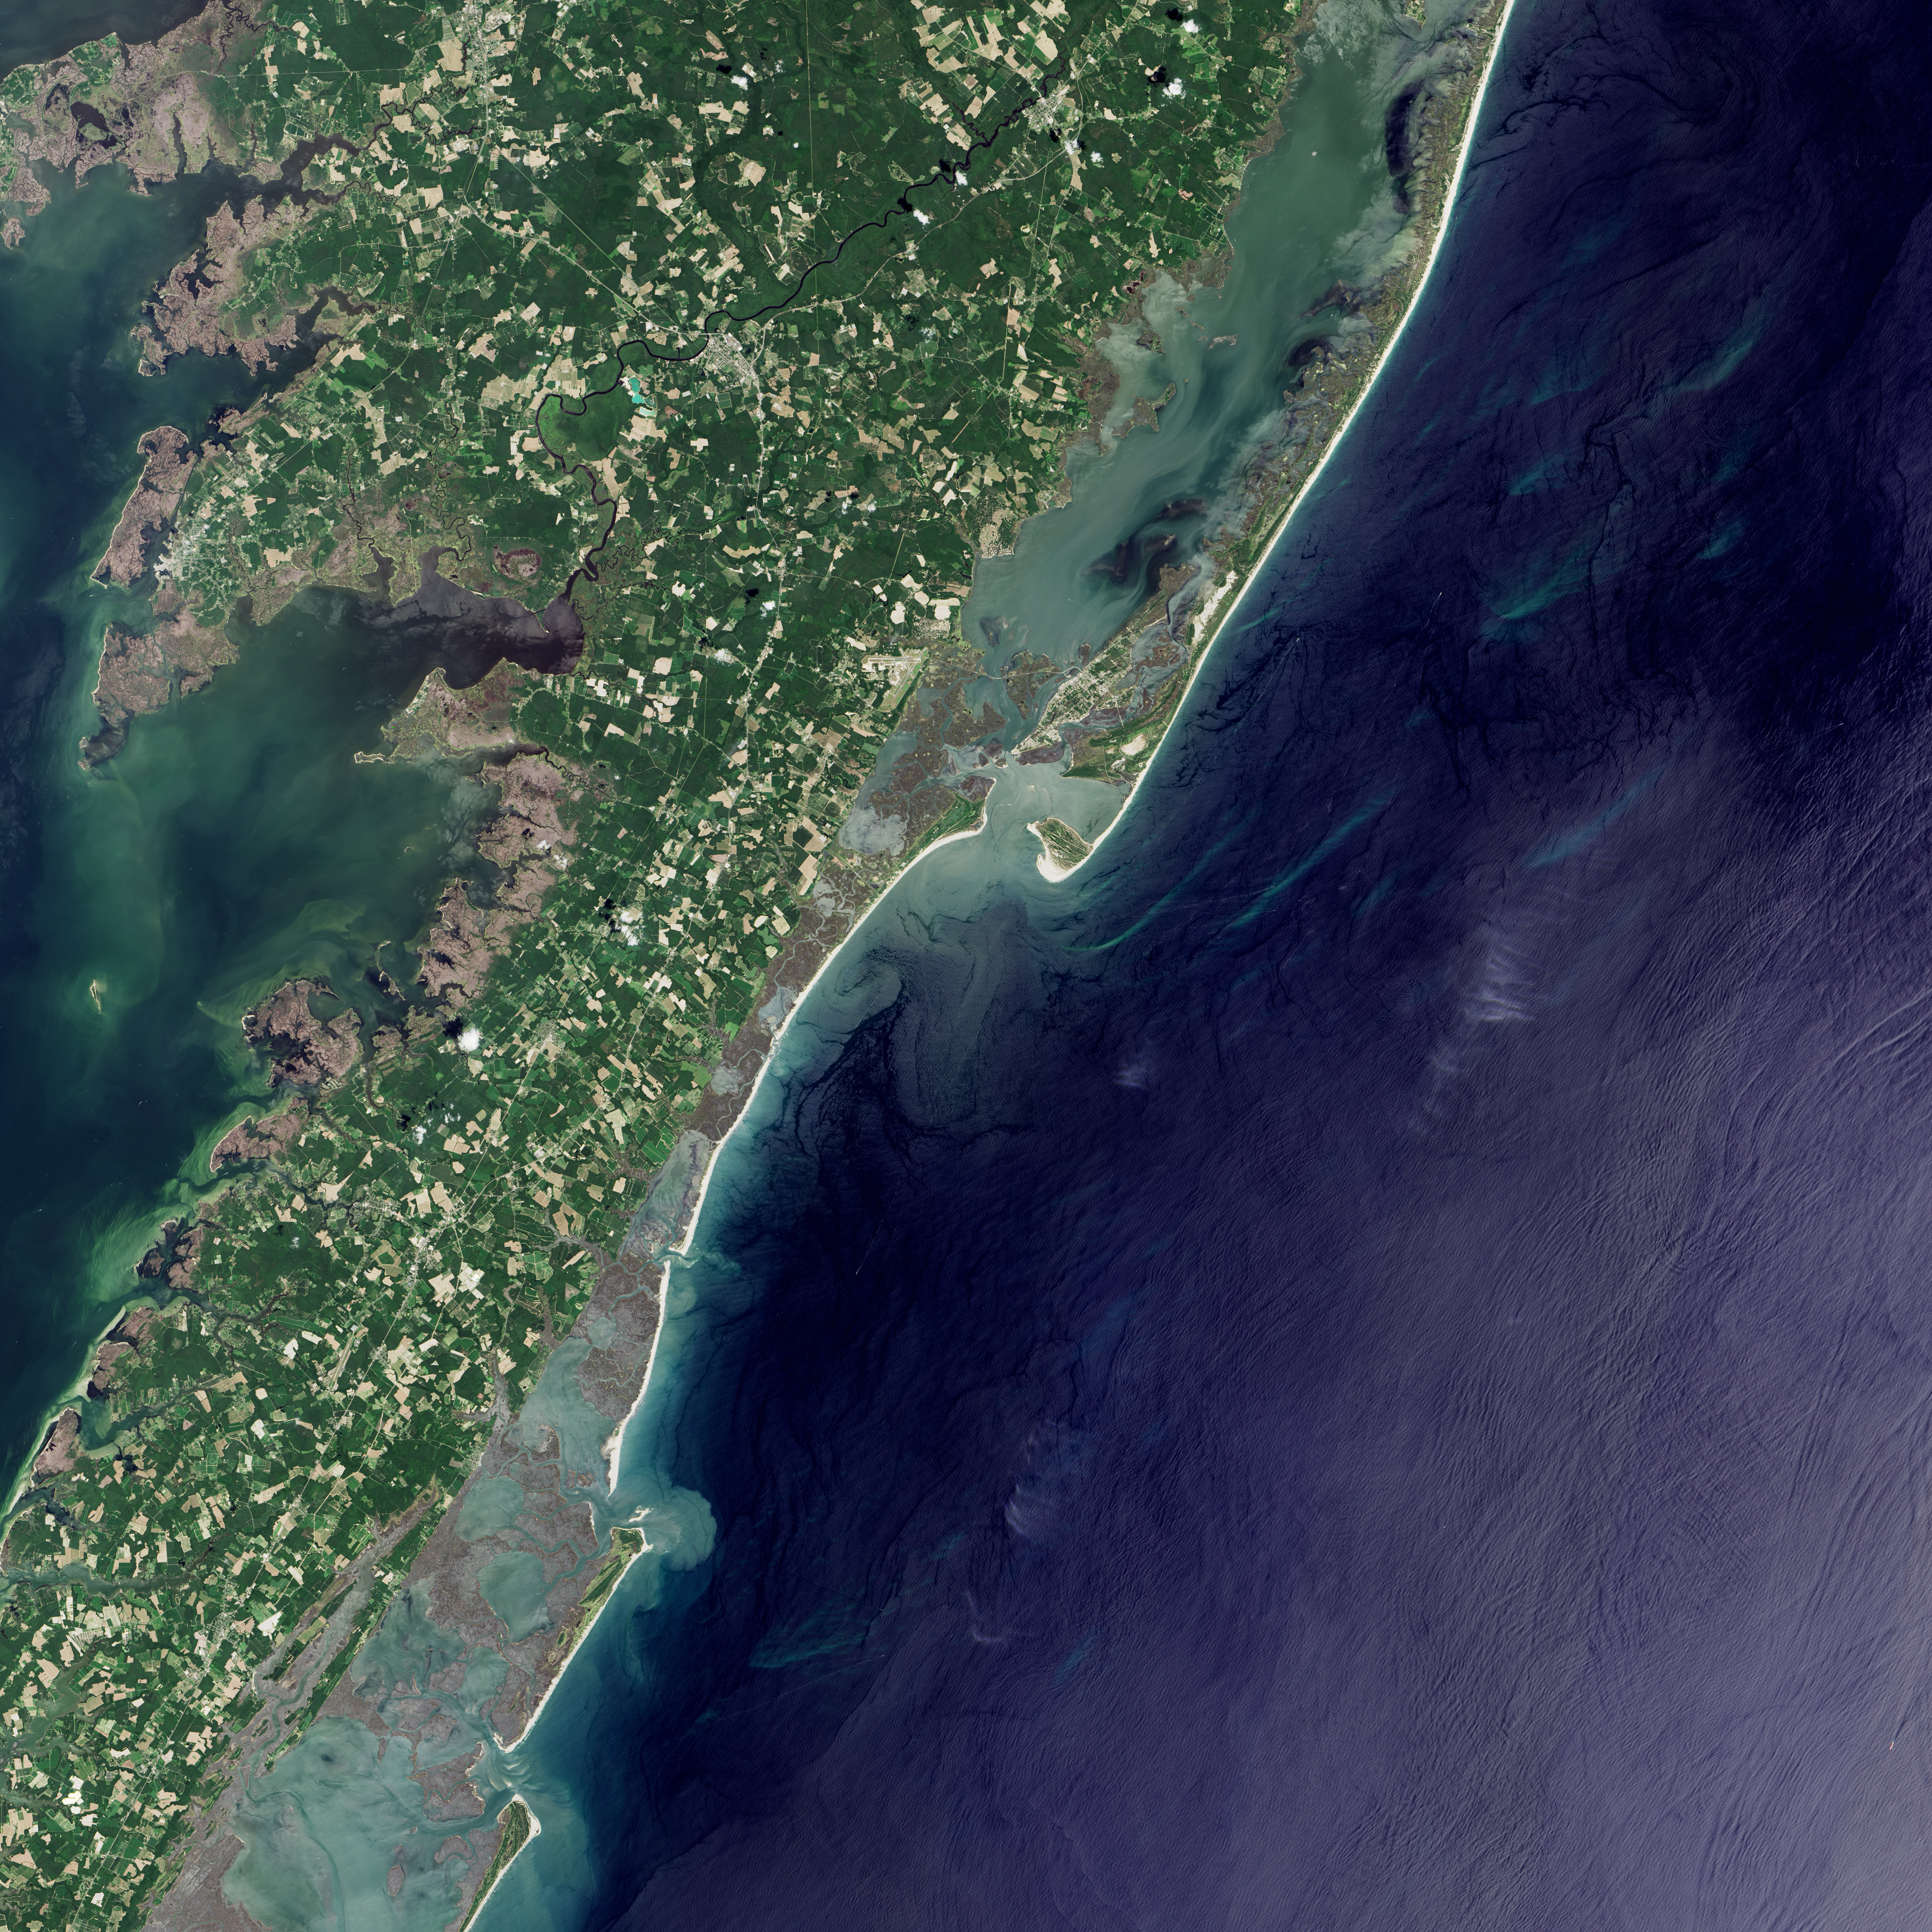
acquired July 25, 2015download large image (18 MB, JPEG, 6000×6000)
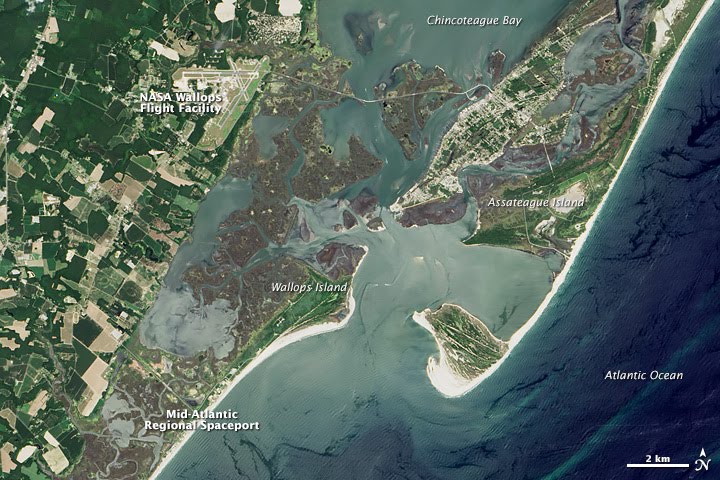
The sea level concerns at Kennedy Space Center are the most visible, but the issue touches most NASA centers. Wallops Flight Facility, carved out of coastal marshland on the eastern shore of Virginia, is most like Kennedy in its vulnerability.
In the past 15 years, Wallops has been redeveloped for launching NASA and commercial rockets, with at least $1 billion in new spaceflight infrastructure being set up along Atlantic shores. But the facility sits amidst a barrier beach system, and those sand bars want to move. Erosion and beach migration have been reshaping the surrounding barrier islands. Assateague has been losing 10 to 22 feet (3 to 7 meters) of beach per year; Wallops Island has been losing about 12 feet.
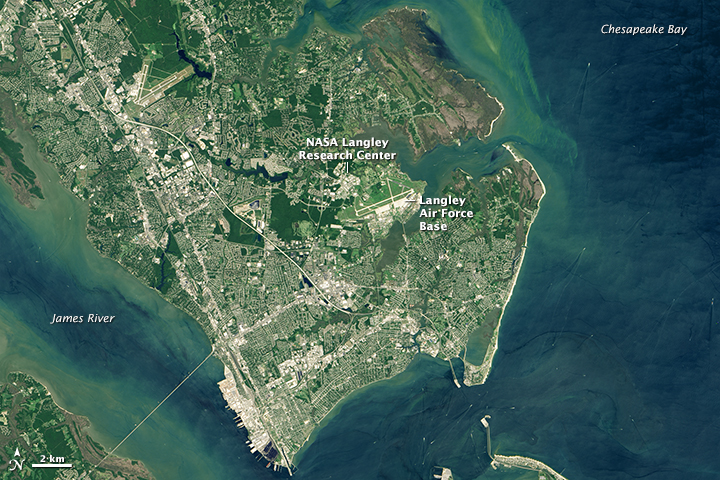
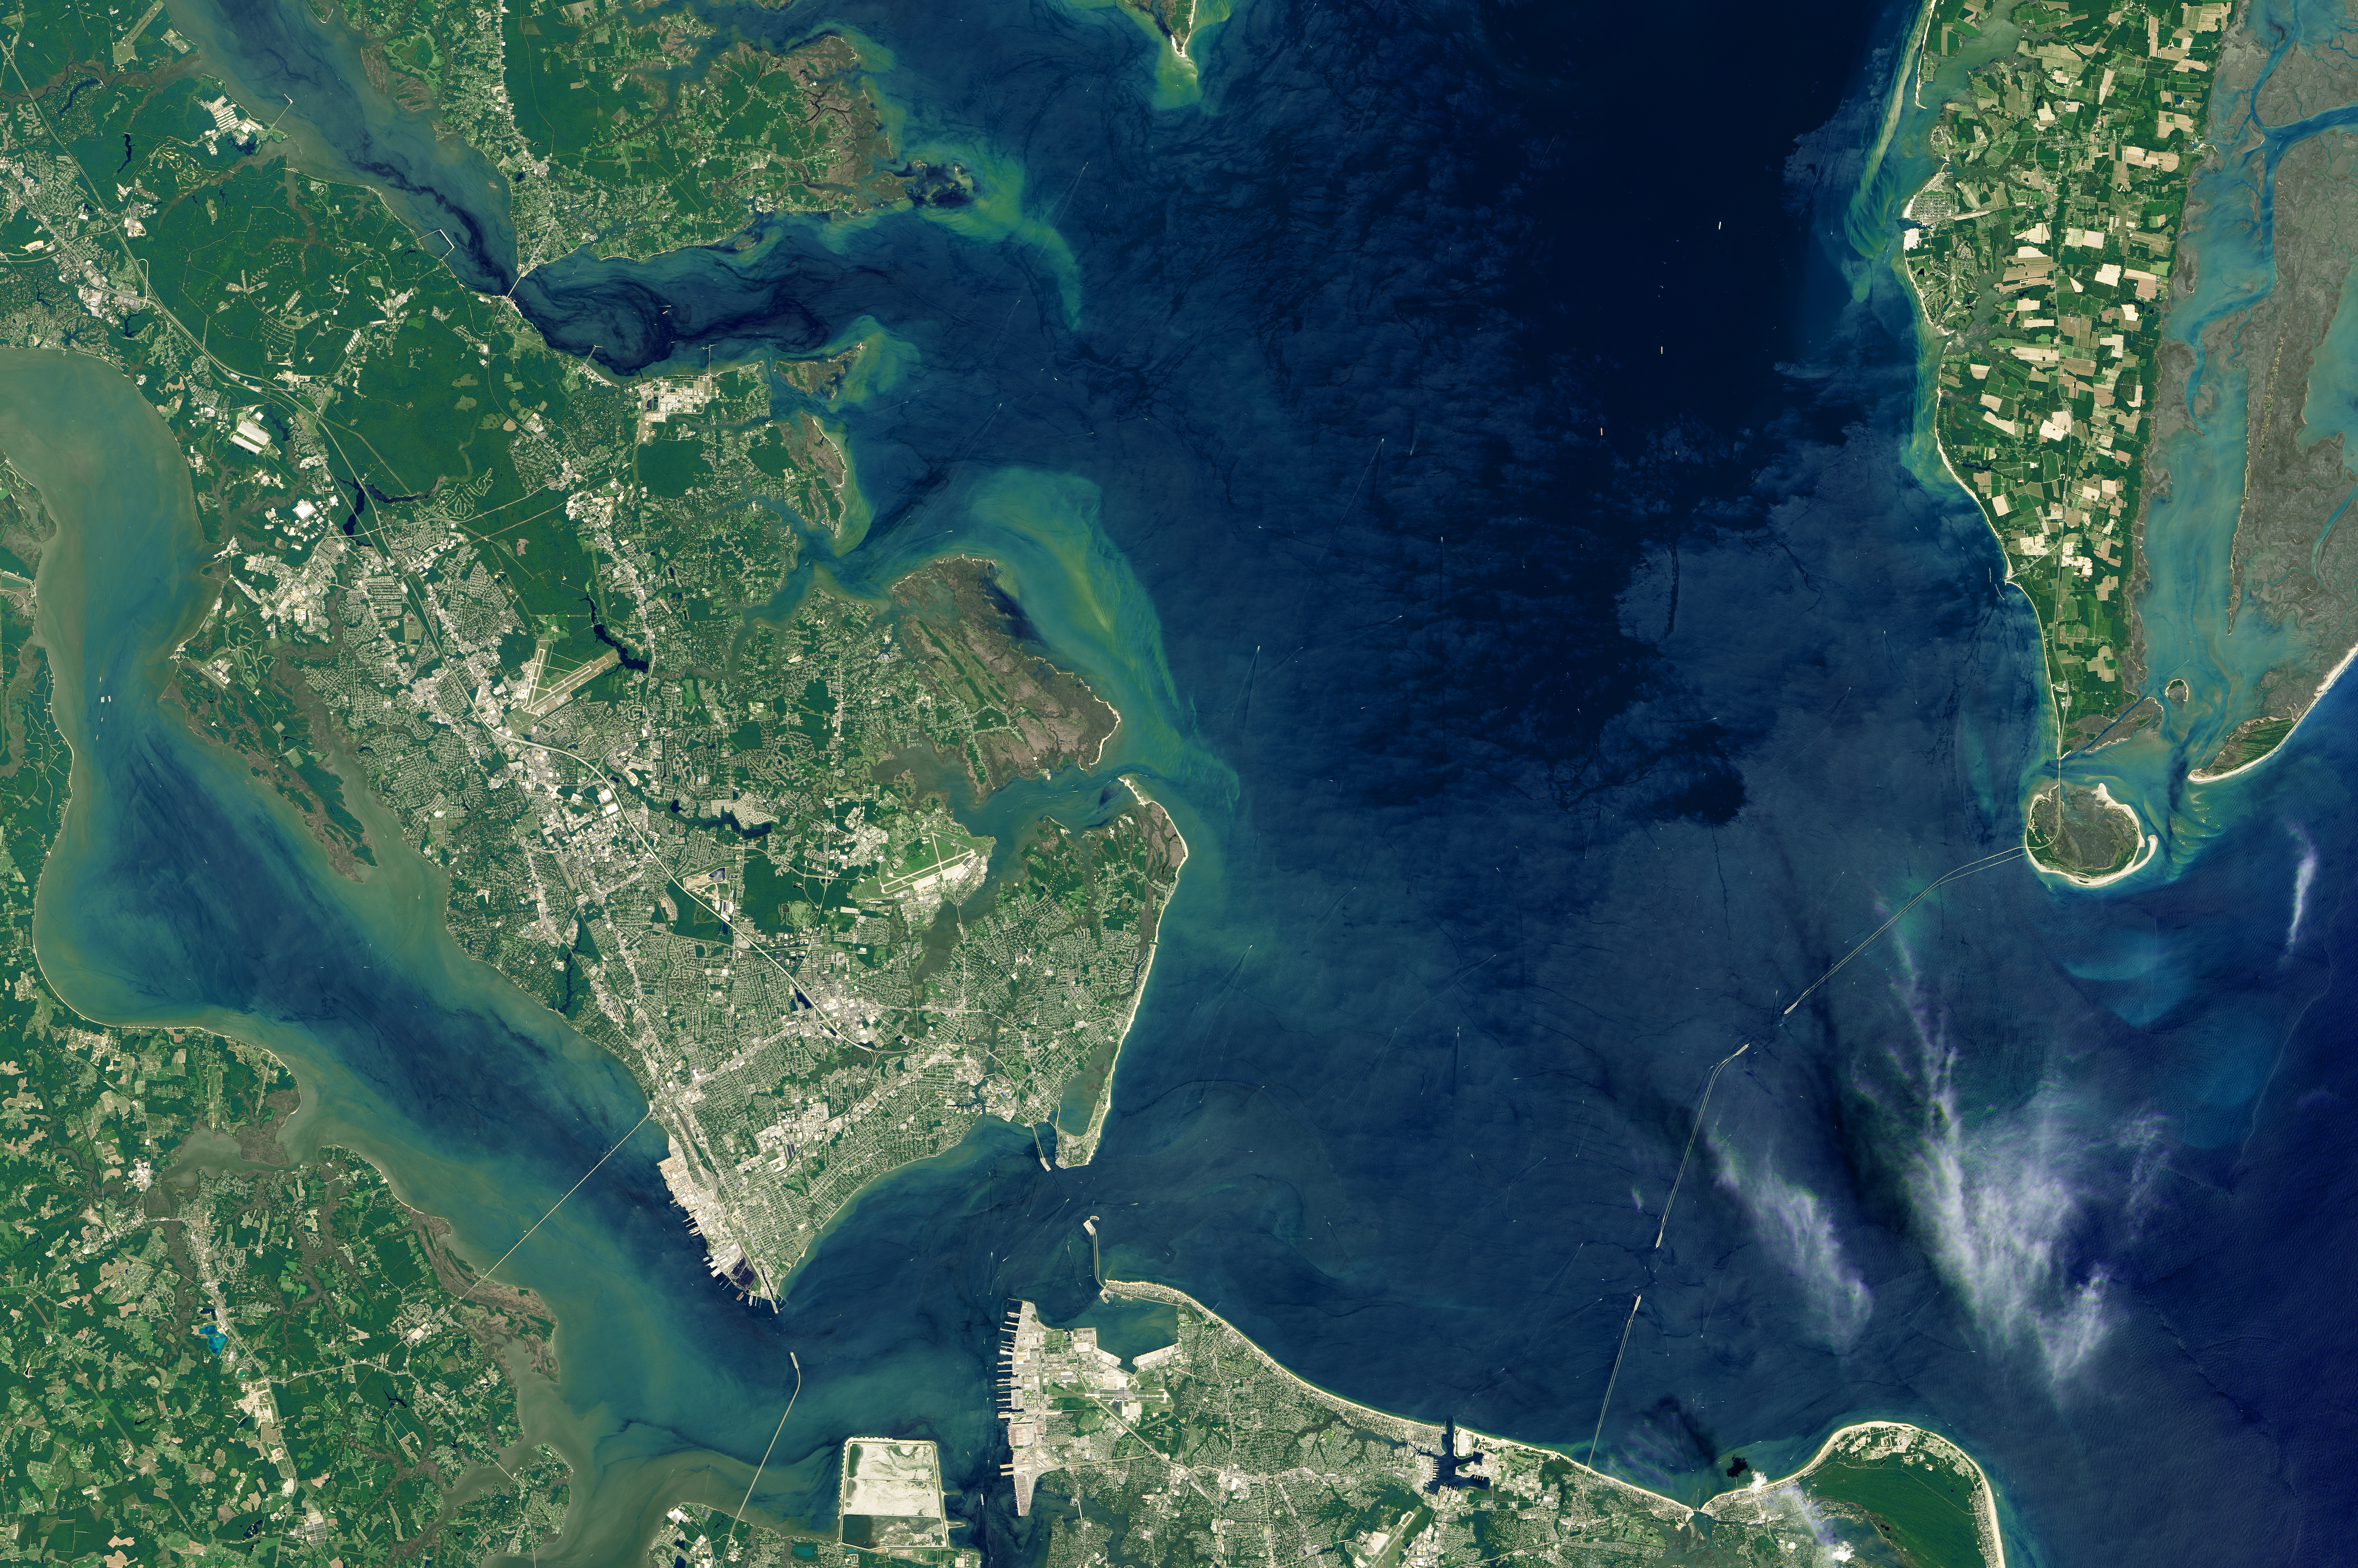
acquired July 25, 2015download large image (14 MB, JPEG, 4837×3217)
Situated near the third largest seaport in the United States and the nation’s largest naval base (Naval Station Norfolk), NASA’s Langley Research Center has to fight both rising seas and sinking land. Scientists have found that sea level around the Chesapeake Bay has been rising at 0.13 inches (3.4 millimeters) per year, twice the global average of 0.07 inches (1.7 mm) per year. Studies have shown that the landforms around the Chesapeake are sinking as a result of processes that started during the last Ice Age.
NASA Article
We in the Chesapeake Bay area have a big concern.
Here is an infograph to think even bigger about the problem.
That brings us to Norfolk, Va.
The Norfolk area is prone to flooding. No seawall will contain that huge Naval Base.
The Washington Post article.
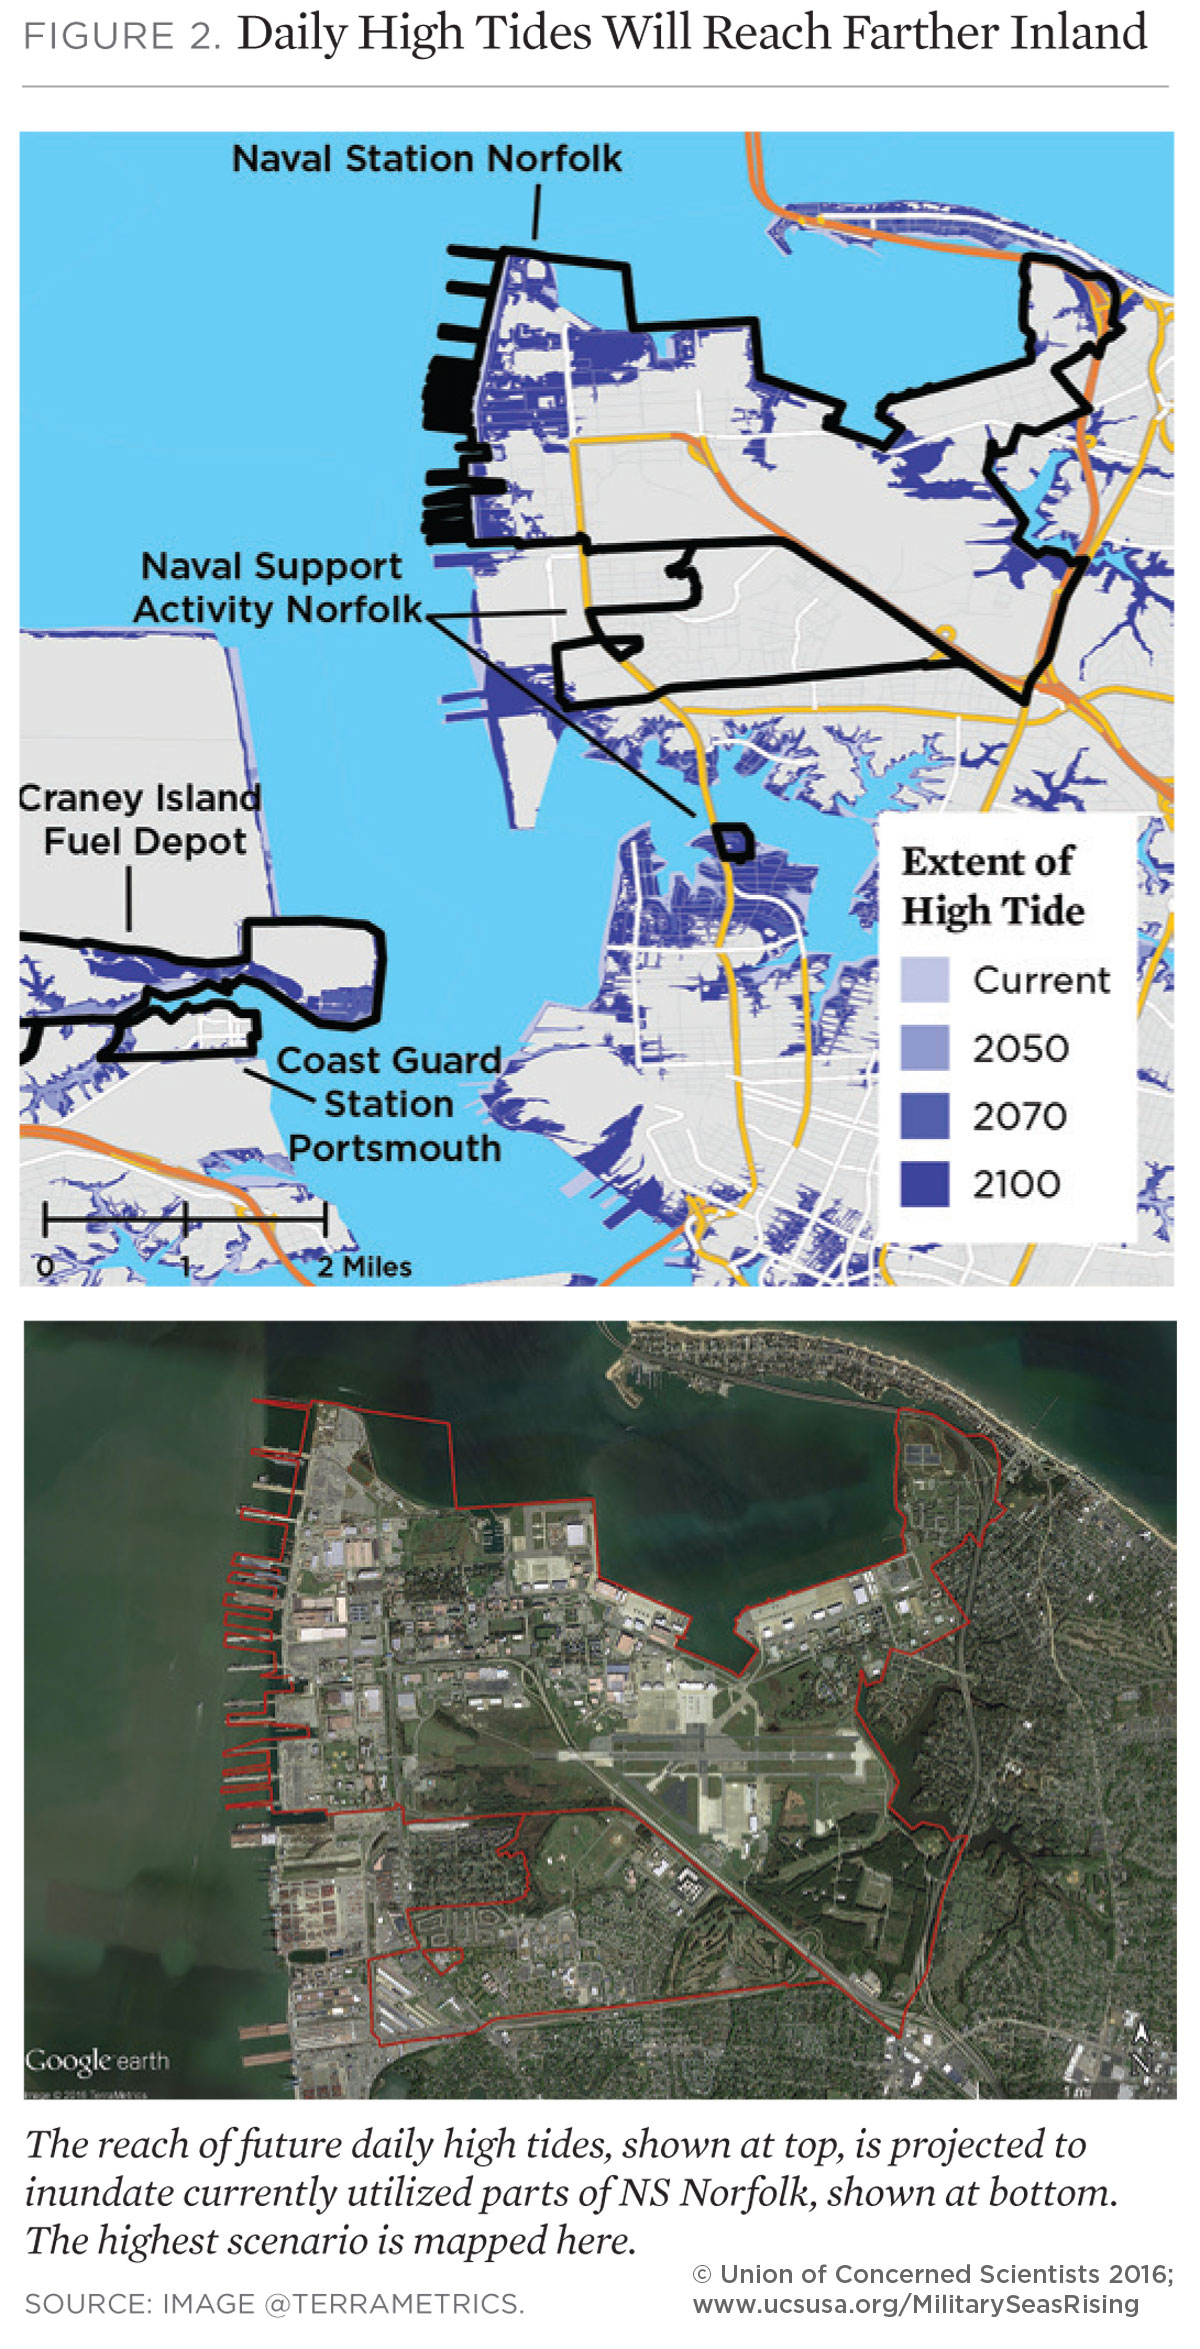
Projected exposure to coastal flooding
The base’s exposure to coastal flooding is projected for the years 2050, 2070, and 2100 based on the National Climate Assessment’s midrange or “intermediate-high” sea level rise scenario (referred to here as “intermediate”) and a “highest” scenario based on a more rapid rate of increase.
Tidal flooding, land loss, and storm surge from hurricanes were all modeled. In this analysis, land inundated by at least one high tide each day is considered a loss. This is a conservative metric: in reality, far less frequent flooding would likely lead to land being considered unusable.
The results below outline potential future flooding scenarios for NS Norfolk, assuming no new measures are taken to prevent or reduce flooding.
- Certain locations could flood with each high tide. Today, tidal flooding in the Norfolk area affects low-lying areas nine times per year on average. But in the intermediate scenario, such areas in and around the station flood about 280 times per year and spend 10 percent of the year underwater by 2050.
- The reach of flooding during extreme high tides will expand. In the intermediate scenario, extra-high tides would expose roughly 10 percent of the station’s land
area to flooding by 2100; in the highest scenario, exposure reaches nearly 60 percent.
- Land loss at NS Norfolk is possible. In the highest scenario, roughly 20 percent of NS Norfolk’s land floods daily, becoming part of the tidal zone, by 2100.
- Sea level rise exposes previously unaffected areas of NS Norfolk to storm surge flooding. In the intermediate scenario, the area exposed to flooding resulting from a Category 1 storm more than triples by 2070.
- Higher sea levels allow lower-intensity storms to produce greater surge. In the intermediate scenario, storm surge flooding resulting from a Category 1 storm hitting in 2100 affects a greater area than does surge flooding resulting from Category 2 storms today.
- Sea level rise exposes NS Norfolk to deeper, more severe flooding. Today, a Category 4 storm exposes about 80 percent of the station to flooding, and that flooding is less than 10 feet deep. In the highest scenario, a Category 4 storm hitting in 2100 exposes 95 percent of the base to flooding more than 10 feet deep.
It is Not Just The Places we have Talked About.
Even in the absence of something very nasty, coastal cities face a twofold threat: Inexorably rising oceans will gradually inundate low-lying areas, and higher seas will extend the ruinous reach of storm surges. The threat will never go away; it will only worsen. By the end of the century a hundred-year storm surge like Sandy’s might occur every decade or less. Using a conservative prediction of a half meter (20 inches) of sea-level rise, the Organization for Economic Co-operation and Development estimates that by 2070, 150 million people in the world’s large port cities will be at risk from coastal flooding, along with $35 trillion worth of property—an amount that will equal 9 percent of the global GDP. How will they cope?
We need to involve students in the study of the environment .
Teachers need resources to share with the students and the community.
VISIONING
For nearly a thousand years the Dutch have been reclaiming land from the sea—and occasionally losing some. A catastrophic flood that killed more than 1,800 people in 1953 spurred the country to develop the world’s most elaborate and sophisticated system of dikes and other defenses. The most critical structures are built to withstand a 1-in-10,000-year storm


 The topics were the beginning of real science study for many students.