Seeing and Solving World Problems with Geography, GIS/Esri, National Geographic!!!

First, we are glad to be involved, informed and educated.

National Geographic has free courses for teachers that are awesome , and they provide ways of having us see the world, as we learn.

Here is how we analyze world problems.

Think environment and big data. The science of where?

The Science of Where – Unlock Data’s Full Potential (the big picture)

We use technology in powerful ways. We hope that students are learning subjects for the facilitation of knowledge to use on a daily basis.

There is a world problem in the understanding of the effects of the Corona Virus. COVID-19 .

Here are ladders to learn about it using data.

Scientists and Geography and GIS unite to share knowledge with you using visual data.

COVID-19 Global Cases by Johns Hopkins CSSE

https://gisanddata.maps.arcgis.com/apps/opsdashboard/index.html?fbclid=IwAR1rpqMAAsd91tIdihCDVewtjH3TLIcn2ZTpfD69Kt5jTChXv7Wu9k0utQ4#/bda7594740fd40299423467b48e9ecf6

What is GIS? | Geographic Information System Mapping … – Esri

https://www.esri.com › en-us › what-is-gis › overview

A framework to organize, communicate, and understand the science of our world..do you know it?

A geographic information system (GIS) is a framework for gathering, managing, and analyzing data. … It analyzes spatial location and organizes layers of information into visualizations using maps and 3D scenes.

Lancet Inf Dis Article: Here. Mobile Version: Here. Visualization: JHU CSSE. Automation Support: Esri Living Atlas team and JHU APL.

Data sources: WHOCDCECDCNHC and DXY. Read more in this blogContact US.

Big data explains in different ways without politicizing.

If your schools are not teaching this they should.

https://www.esri.com/en-us/home


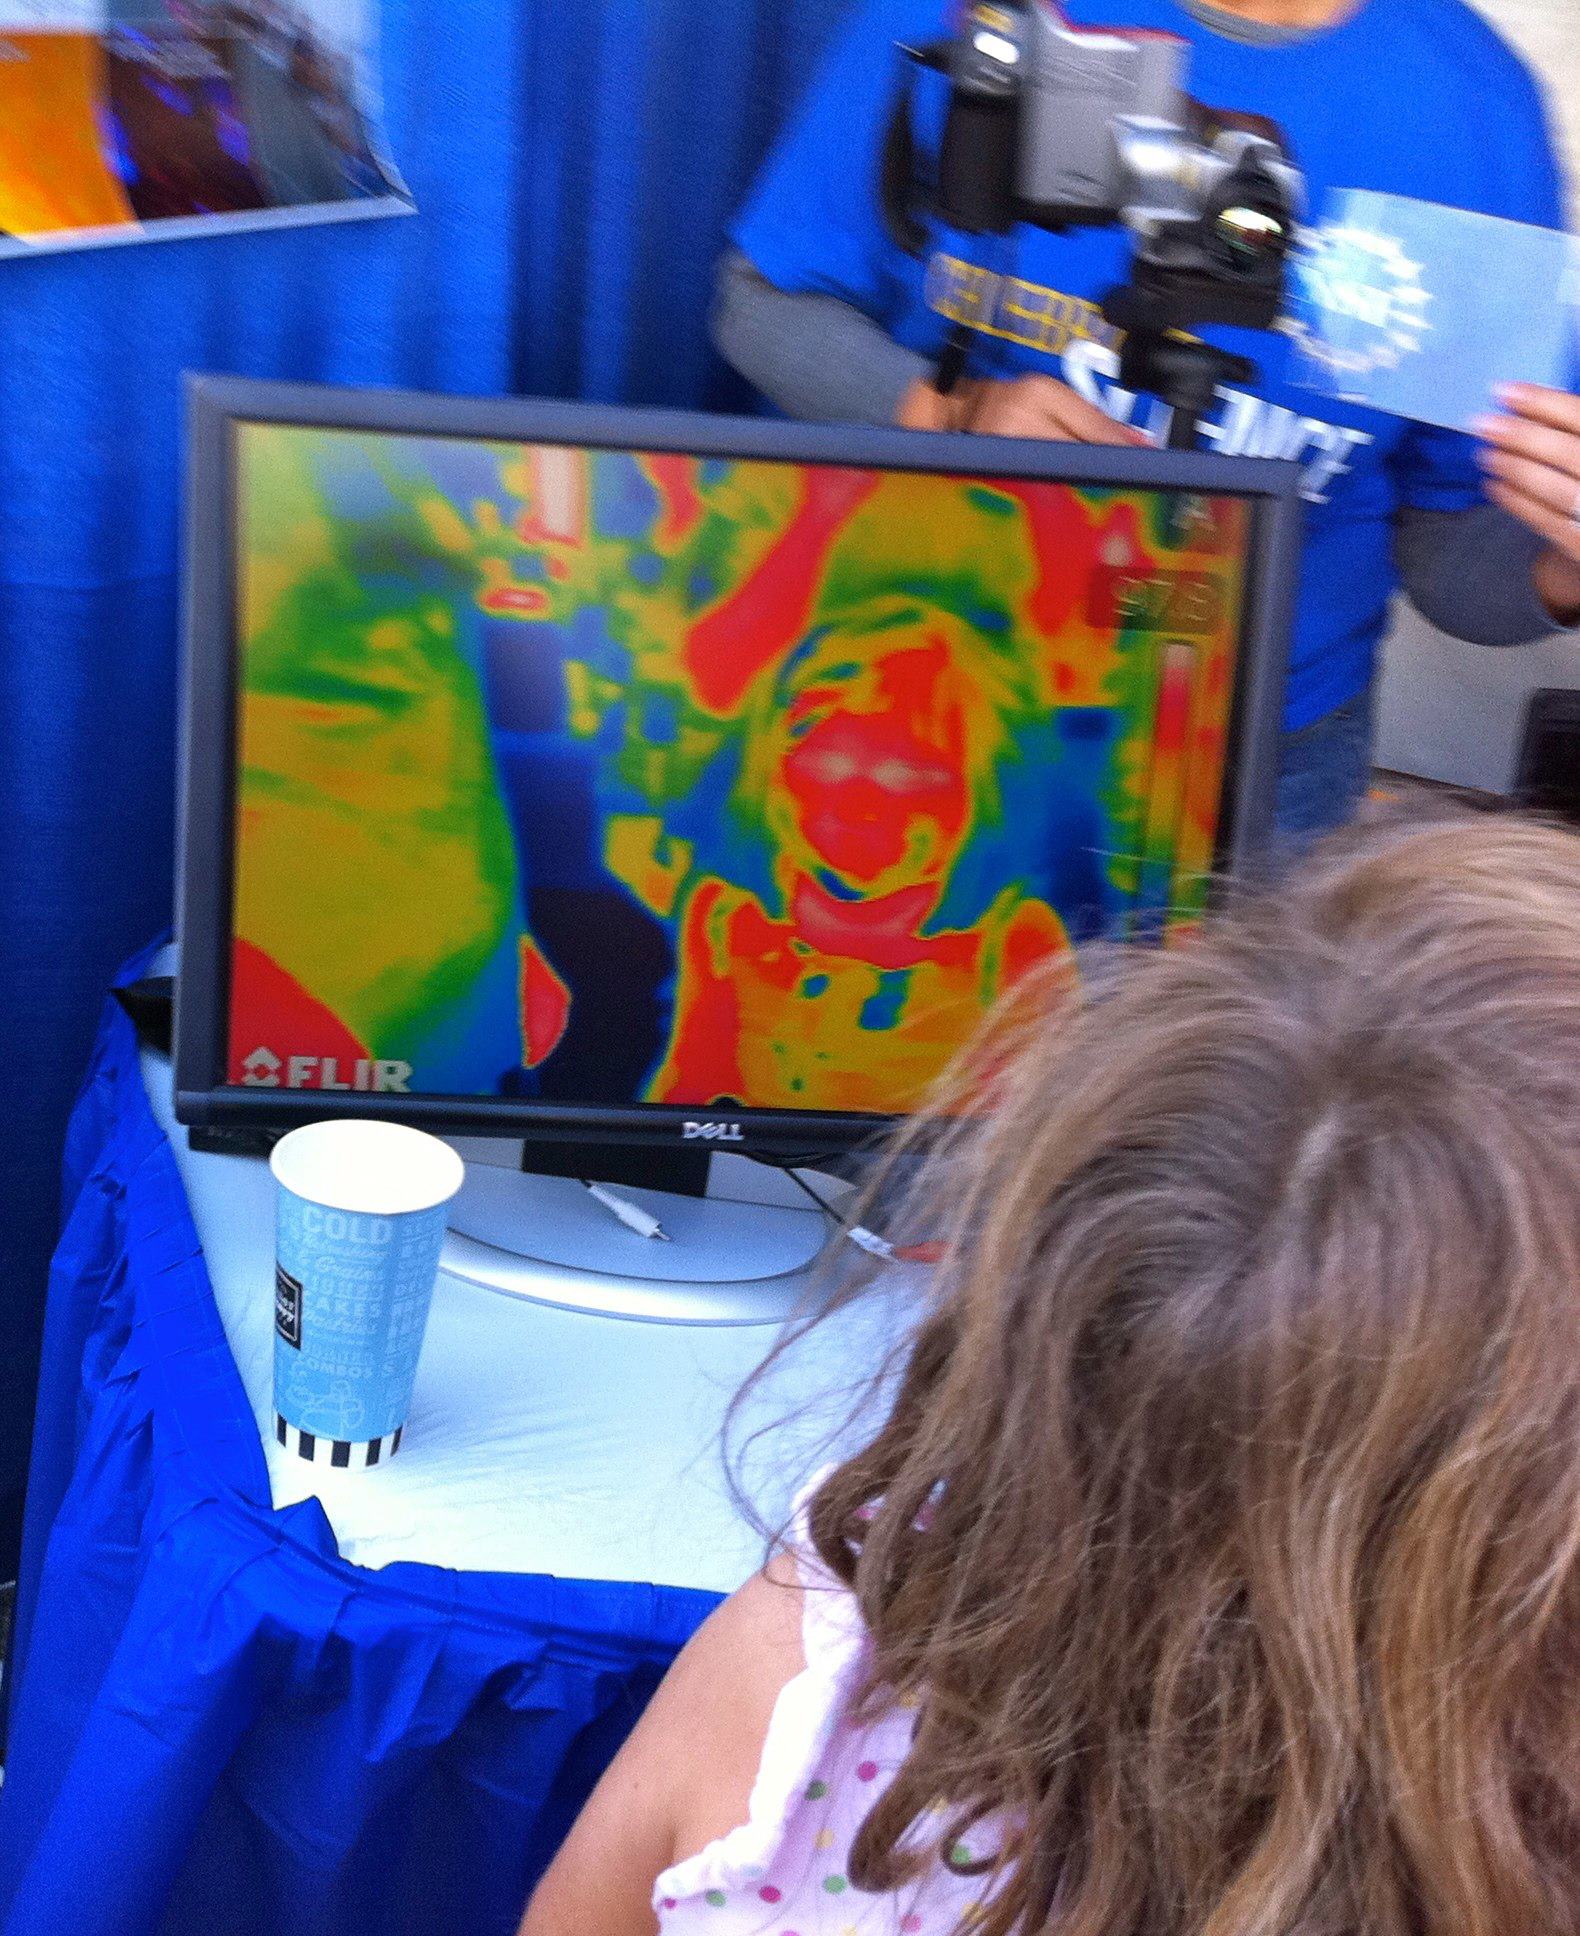
Students can experience use of NOAA’s examples in schools and museums.

They can also

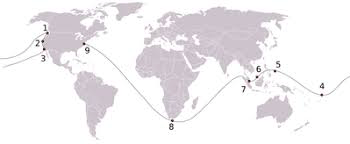
Education | Science On a Sphere

Science On a Sphere® is a unique and captivating educational tool that is used in science museums, visitor centers, zoos, aquariums, laboratories, and schools around the world. The Science On a Sphere® team and the SOS Users Collaborative Network are continually looking for ways to expand the educational capabilities of SOS. The educational material created to support SOS is available here, including scripts, lessons plans, and evaluations

What is Science On a Sphere®?

Science On a Sphere® (SOS) is a room sized, global display system that uses computers and video projectors to display planetary data onto a six foot diameter sphere, analogous to a giant animated globe. Researchers at NOAA developed Science On a Sphere® as an educational tool to help illustrate Earth System science to people of all ages. Animated images of atmospheric storms, climate change, and ocean temperature can be shown on the sphere, which is used to explain what are sometimes complex environmental processes, in a way that is simultaneously intuitive and captivating.

Science On a Sphere® extends NOAA’s educational program goals, which are designed to increase public understanding of the environment. Using NOAA’s collective experience and knowledge of the Earth’s land, oceans, and atmosphere, NOAA uses Science On a Sphere® as an instrument to enhance informal educational programs in science centers, universities, and museums across the country. Science On a Sphere® is available to any institution and is currently in operation at a number of facilities in the US.

What is SOS Explorer?

SOS Explorer (SOSx) is a flat screen version of the widely popular Science On a Sphere®(SOS). The revolutionary software takes SOS datasets, usually only seen on a 6-foot sphere in large museum spaces, and makes them more accessible. The visualizations show information provided by satellites, ground observations and computer models.

There are two versions available. SOS Explorer is an exhibit-quality version and SOS Explorer Mobile is a free introductory version. Learn more about SOSx here!


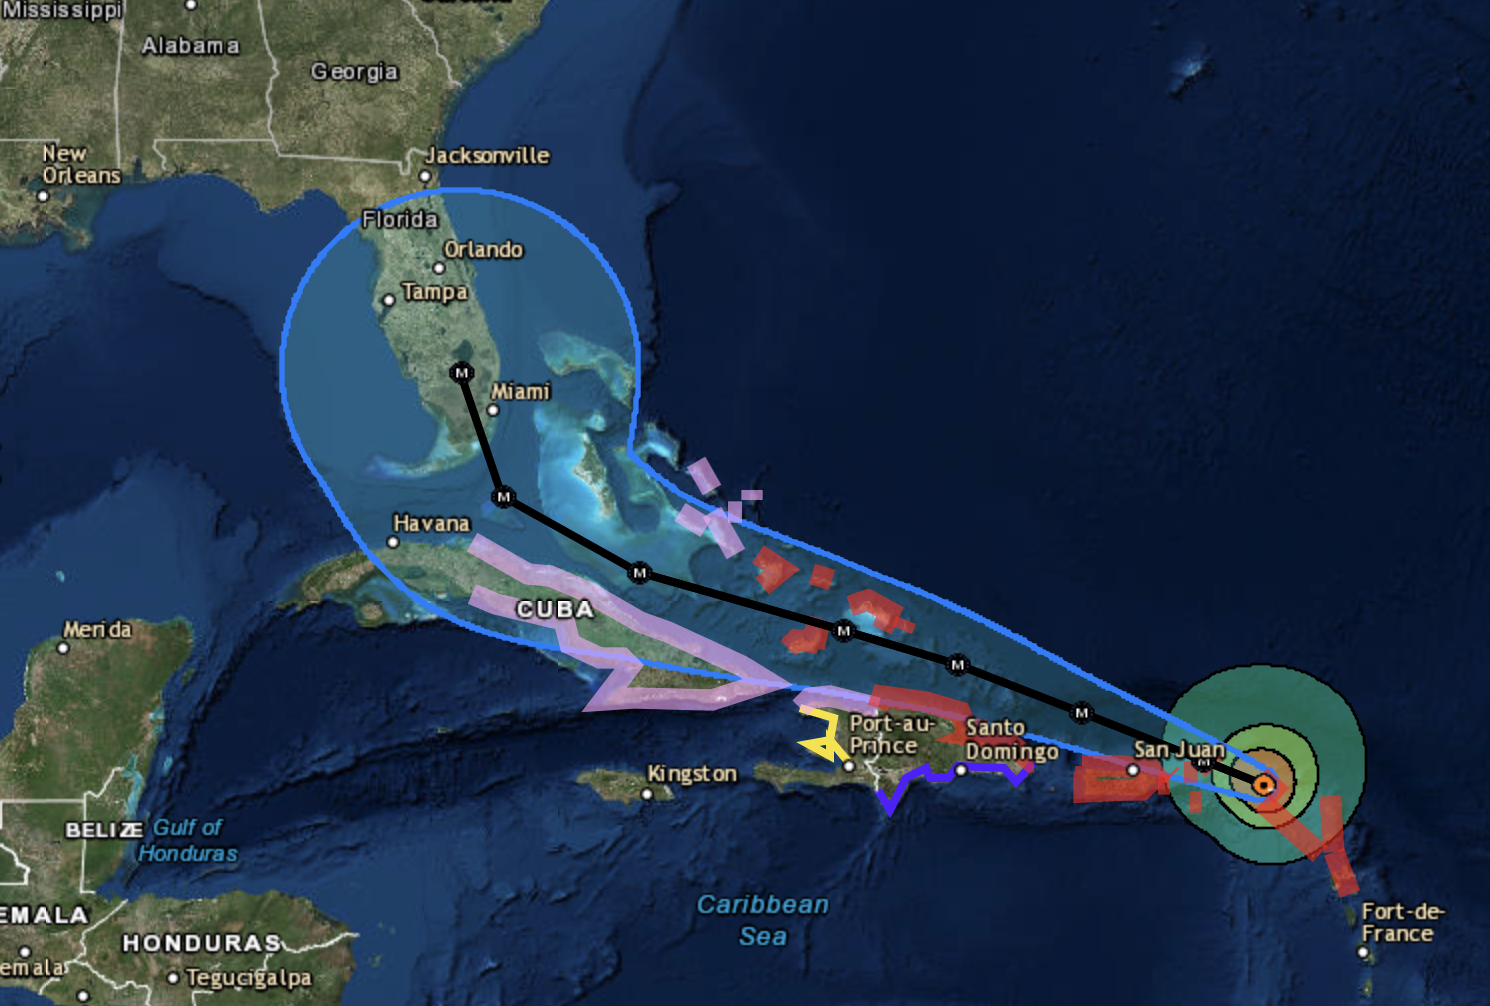
Esri’s Disaster Response Program (DRP) assists with disasters worldwide as part of corporate citizenship. They support response and relief efforts with GIS technology and expertise when your capacity is exceeded.

When you need help quickly, Esri can provide data, software, configurable applications, and technical support for your emergency GIS operations. Use GIS to rapidly access and visualize mission-critical information about the specific locations affected by a disaster. Get the information you need fast, in a way that’s easy to understand, to make better decisions during a crisis.

GIS, Geoliteracy, and ESRI..What are you waiting for?

This year the changes in climate, the storms and devastation have caused us all to take time to pay attention to weather, to where places are and to what a disaster map is in many places. You should have also learned how and why storms are tracked.

People all of a sudden were worrying and watching the weatherman or a climate mapping system for news about fires, floods, the hurricanes. ESRI provided story maps and data for all to see. Problem? Many students  in the US do not study or use resources that are available free for schools.

During the Hurricane emergencies we could use this map.  There were individual story maps that you could use during the hurricanes, to learn to read, see , big data define the hurricane.Hurricane Harvey  , Hurricane Irma, Hurricane-Irma-1054595

Hurricane Maria

http://gis.ruekert-mielke.com/2017/09/14/esri-story-map-of-hurricane-harvey/

There were also story maps of the fires.

You can learn using ESRI resources.

What is a disaster that is likely to happen in your area? What is the history of weather in your area? What actions should you be ready to take?


iu

There are lots of fabulous tools that we can use to learn about Earth Science. One of my favorite is Science on a Sphere. You can learn about it here. SOS  There are lots of locations where you can go and participate in an SOS program. There is also SOS Lite. That is a download that you can install on your computer. Here is the link. SOS Lite.

Climate Models?

What Is a Climate Model?

Global climate models (GCMs) use math – a  lot of math – to describe how the atmosphere, the oceans, the land, living thingsice, and energy from the Sunaffect each other and Earth’s climate. Thousands of climate researchers use global climate models to better understand how global changes such as increasing greenhouses gases or decreasing Arctic sea ice will affect the Earth. The models are used to look hundreds of years into the future, so that we can predict how our planet’s climate will likely change.

There are various types of climate models. Some focus on certain things that affect climate such as the atmosphere or the oceans. Models that look at few variables of the climate systemmay be simple enough to run on a personal computer. Other models take into account many factors of the atmospherebiospheregeospherehydrosphere, and cryosphere to model the entire Earth system. They take into account the interactions and feedbacks between these different parts of the planet. Earth is a complex place and so many of these models are very complex too. They include so many math calculations that they must be run on supercomputers, which can do the calculations quickly. All climate models must make some assumptions about how the Earth works, but in general, the more complex a model, the more factors it takes into account, and the fewer assumptions it makes. At the National Center for Atmospheric Research (NCAR), researchers work with complex models of the Earth’s climate system. Their Community Climate System Model is so complex that it requires about three trillion math calculations to simulate a single day on planet Earth. It can take thousands of hours for the supercomputer to run the model. The model output, typically many gigabytes large, is analyzed by researchers and compared with other model results and with observations and measurement data.

NESTA  Souce

There are currently several other complex global climate models that are used to predict future climatic change. The most robust models are compared by the IPCC (Intergovernmental Panel on Climate Change) as they summarize predictions about future climate change.

There are tools that are used to predict weather and to define possibilities that are data models. There is a European Model, and a US Model which we learned from with all of the storms, and fires, in the last several months.

The European Climate Model

  • produces numerical weather forecasts and monitor the Earth-system;
  • carries out scientific and technical research to improve forecast skill;
  • maintains an archive of meteorological data.

To deliver this core mission, the Center provides:

  • twice-daily global numerical weather forecasts;
  • air quality analysis;
  • atmospheric composition monitoring;
  • climate monitoring;
  • ocean circulation analysis;
  • hydrological prediction.

They also provide advanced training to scientific staff in our Member and Co-operating States and assist the World Meteorological Organization with its programs. We make 25% of the supercomputing facilities available to Member States.

The US Climate Model is here.

https://www.climate.gov/teaching And you can look here

How reliable are computer models of the Earth’s climate?

Climate models are used to analyze past changes in the long-term averages and variations in temperature, precipitation, and other climate indicators, and to make projections of how these trends may change in the future. Today’s climate models do a good job at reproducing the broad features of the present climate and changes in climate, including the significant warming that has occurred over the last 50 years. Hence, climate models can be useful tools for measuring the changes in the factors that drive changes in climate, including heat-trapping gases, particulates from human and volcanic sources, and solar variability.

Scientists have amassed a vast body of knowledge regarding the physical world. However, unlike many areas of science, scientists who study the Earth’s climate cannot build a “control Earth” and conduct experiments on this Earth in a lab. To experiment with the Earth, scientists instead use this accumulated knowledge to build climate models, or “virtual Earths.” In studying climate change, these virtual Earths serve as an important way to integrate different kinds of knowledge of how the climate system works. These models can be used to test scientific understanding of the response of the Earth’s climate to past changes (such as the transition from the last glacial maximum to our current warm interglacial period) as well as to develop projections of future changes (such as the response of the Earth’s climate to human activities).

Climate models are based on mathematical and physical equations representing the fundamental laws of nature and the many processes that affect the Earth’s climate system. When the atmosphere, land, and ocean are divided up into small grid cells and these equations are applied to each grid cell, the models can capture the evolving patterns of atmospheric pressures, winds, temperatures, and precipitation. Over longer timeframes, these models simulate wind patterns, high and low pressure systems, and other weather characteristics that make up climate.

Some important physical processes are represented by approximate relationships because the processes are not fully understood, or they are at a scale that a model cannot directly represent. Examples include clouds, convection, and turbulent mixing of the atmosphere, for which important processes are much smaller than the resolution of current models. These approximations lead to uncertainties in model simulations of climate.

Climate models require enormous computing resources, especially to capture the geographical details of climate. Today’s most powerful supercomputers are enabling climate scientists to more thoroughly examine the effects of climate change in ways that were impossible just five years ago. Over the next decade, computer speeds are predicted to increase another 100 fold or more, permitting even more details of the climate system to be explored.

.Source

ucar_model_inputResources for schools.


Internet of Things? Some Are Waiting for Access to the Internet , the Tools and Well Trained Teachers

I always smile when a reporter says, in education we have too many tools , too much of the Internet and we should cut back and enjoy our real lives. Now the report is that STEM initiatives are harmful and of course we are excluding the arts.

Most of what minorities claim in technology has to do with the arts.

What we are they talking about?

Superhero kid. Girl power concept

Our minority students have to be Super students to be successful.

I doubt that most minority community schools have truly embedded STEM into their learning landscapes.That is where I work , and these are my constituents.

If we had sufficient STEM and Computational resources and training available, why is Silicon Valley having so much trouble hiring minority workers? We who are minorities know. There are researchers who know , but it is probably news to many reporters that there are people still waiting to be on the internet ( get access) , waiting to have teachers who are schooled in using the Internet in school and who don’t have the tools. Some think that mobile devices equalize. I think a mobile device is better than nothing.

Jesse Jackson is taking on the President, saying that he is responsible for the lack of diversity. Read my lips.

We have an education problem.

NCLB decimated the layer of science learning for more than a decade simply because it was not tested. Math , the real math that scientists use? Not taught . The skills that students need to be active in STEM and working in Silicon Valley were simply not taught in many cases because of the emphasis on testing in many schools, particularly those with challenging  minority enrollments,poverty as a problem and a weak teacher base. We know that the best of teachers are not often based in the places of most need.Every Job in America, Mapped

Here is a map to show where the jobs are in America. ( Present Jobs)

http://jobs.aol.com/articles/2015/08/11/every-job-in-america-mapped/?SiteID=cbaolcompromotion_aug_11Map of Jobs in America

We know that the present jobs are not the jobs of the future. Years after the invention of the Internet there are people still out of the loop for the use of technology. What jobs are they being prepared for? A week of code will not do it. Actually , workshops are a tease, and unless instruction is sustained, posters and contests don’t do much for those who are limited in access (or who have no access).

Explore it.

It is different in different places.The elements are similar. Here is the research.

 A Vignette

Using data from the National Center for Education Statistics, the US Census Bureau and Intel’s own internal numbers, Intel  determined the market availability of men, women, African American, Hispanic, and Native American candidates, and how its workforce measured up to those numbers. According to the company’s report, it did fairly well: for instance, Intel has 19.4 percent female representation where market availability is at 22.7 percent; 3.3 percent of its workforce is African American where there is 4.5 percent availability of candidates in the market.

In other words, the main limiting factor on the presence of diverse groups in Intel’s workforce is not Intel’s policies but availability of candidates with the right skills in the workforce as a whole.

Intel is not alone.

Remember my discussion about running to catch up? We are still asking for access , well trained teachers and tools. We are not all on the Internet and the Internet of Things is becoming a discussion point.

There is a lot of research to share the difficulties that those who are not on the Internet are having.

For many of us, a life without Internet might be hard to imagine. Yet, 15 percent of U.S. adults say they never go online, according to a new study from the Pew Research Center.

The survey, published in late July, found that the offline population has been shrinking significantly since 2000, when Pew began collecting data on Internet use. Back then, 48 percent of American adults weren’t online. However, in the past couple years, the size of this group hasn’t changed too much.

In the graph below, you can see that the downward trend has flattened recently:

“We’ve seen slow but steady adoption progress among a lot of demographic groups that have historically used the Internet in low numbers, such as older adults, or those with low income and education levels,” Aaron Smith, Pew’s associate director of research, told the Huffington Post in an email. “With that said, there are definitely still disparities around this issue and Internet usage overall really hasn’t changed measurably in the last two years.”

In fact, the latest Pew survey reveals that Internet non-adoption is still largely consistent with a series of factors such as age, education, household income and race and ethnicity. The chart below breaks down the demographics of non-users based on these different metrics:

Who's Not Online?

Seniors make up the majority of Internet hold-outs by age group: About 39 percent of adults 65 and older aren’t online, compared with only 3 percent of 18- to 29-year-olds. In addition, people who lack a high school education, or whose household income is less than $30,000 per year, are also more likely to stay offline.

The Pew survey also indicated that digital gaps among different racial groups are narrowing. Back in 2000, the Internet population was more homogenous than today: 72 percent of Asian-Americans were online, compared to 53 percent of White people, 46 percent of Hispanics and 38 percent of African-Americans. Over the past 15 years, African-Americans have have seen the fastest growth, with Internet usage rates now approaching that of whites.

SOURCE: http://www.huffingtonpost.com/entry/internet-access-americans_55c8b719e4b0923c12bd69fe

I have personal experience with helping with STEM, Broadening Engagement in Supercomputing and Coding, as well as ESRI.

I most recently trained with ESRI to be able to participate in helping education communities to use EdConnect.

It is an initiative that the President backs.

child Head

EDUCATION

“If we want America to lead in the 21st century, nothing is more important than giving everyone the best education possible — from the day they start preschool to the day they start their career.”

—President Barack Obama

http://www.esri.com/connected

I trained to be a mentor and disseminator of the program. It’s free.I was told that there is not time to learn it ( there is an online course) that teachers have testing to deal with and so there is no time. A dear friend of mine told me that the computers are needed for testing and so that during most testing times, computers are not available. * Sadly , in low performing schools, there is the pre testing, the preparation for testing , and then the testing. You know it is an important problem because of the cheating problems. One principal actually killed herself based on concerns about testing.

Are you listening?

So people are talking about the Internet of things. We are not even at the Internet. So sad.

Minority students are makers. We always have been. We are good in the arts. Making the future is harder. People who have what they need rarely consider what minority students in poor schools are having to do to make a future.

NASA used to be our engine of opportunity. The press does not report on NASA as in the past, and schools don’t give permission. They have outstanding programs. Some of us have been trained in several NASA programs. It is where lots of us learned astronomy, physics, and astrophysics. Programs are outstanding, I love NASA Quest, the Challenger Center see these resources, Fly By Math, and Hubble Astronomy, IE Amazing Space.

But wait, there is more. Geography!! We talk about the world without studying it in most cases.Do we really want to throw away the fabulous resources of the National Geographic in STEM? Or not use the vast resources of the National Geographic Society? STEAM included?

How do you become an engineer if you don’t get an introduction? Just saying. We have a problem in education.

childStudy: Most K-12 schools lack engineering-centered education

Can you hear me? STEM is still needed.

Internet of Things? Well it is here. Let’s hope that some synergy happens.

Orienteering, STEM Skills that link to GPS, and GIS… Esri Here I Come

There are all kinds of games, simulations and events that kids get to experience on devices. We looked at a simulation of the oil spill on the Ipad.

There are all kinds of games, simulations and events that kids get to experience on devices. We looked at a simulation of the oil spill on the Ipad.

Hands on a globe

Sometimes you think you know all of the answers. I have often worked with kids outside in big spaces. Purposing work in an outdoor lab I never got the connection about electronic orientation. Those girls and boys who worked with me can remember the fun we had at the Outdoor Lab. 


Today in Russian I got the feeling that I could have, with some equipment, prepared kids for a future in STEM or STEAM by adding Esri , What is GIS after teaching orienteering.

orienteering

First let’s look at orienteering.

From Wikipedia, the free encyclopedia

“Orienteering is a family of sports that requires navigational skills using a map and compass to navigate from point to point in diverse and usually unfamiliar terrain, and normally moving at speed. Participants are given a topographical map, usually a specially prepared orienteering map, which they use to find control points.[1] Originally a training exercise in land navigation for military officers, orienteering has developed many variations. Among these, the oldest and the most popular is foot orienteering. For the purposes of this article, foot orienteering serves as a point of departure for discussion of all other variations, but basically any sport that involves racing against a clock and requires navigation using a map is a type of orienteering.”

We know where we are with technology, our phones, our computers and hand held devices. I Think to gain skills that
we should involve more hands on. This training here in Samara is a year long project with two main events for the students, and sometimes an event for disabled people which is done differently. The students go to the Cacausus Mountains and camp out to do the event. It is done by boys and girls and the coaches and volunteers are men and women and

http://www.catchingfeatures.com/ is where you learn.

The game?
Catching Features is an orienteering game you can play at home. Use it for rainy-day training or rest-day enjoyment. Several different modes of play are available. Individual courses are run with interval starts against computer opponents, or with a mass start against lots of them. Relay events allow you to run one leg of a forked relay course.

Each course you run will earn you a number of ranking points based on the other runners that day. By earning more points you can unlock additional events to run.

Internet play allows for races against human opponents all over the world in real time. Race against your friends in a virtual competition! And you thought you didn’t have anything to do at work…

Can’t coordinate a multiplayer game against anyone else, but still want to compare times? Competitions mode allows you to download and run a race whenever you can, then your splits and route choice are automatically uploaded to the CF server for everyone to see and compare!

A random map generator lets you create an endless supply of maps and courses to run on. You can run on a different map every day for the next 89 years…

A map editor is included with the full version of the game. Used for editing maps and planning courses, it allows full control over terrain, vegetation (down to individual trees and rocks), objects (tables, fences, boats…) and all other aspects of the map. An OCAD file converter lets you start building CF maps from your favorite local terrain.

You can also use the included Ocad Converter to convert your library of Ocad maps into playable CF maps! Train on your home forests!

That is the simulation!!
Hear are pictures of the real thing using tools.orient

From Russia with orienteering tools.

What is GIS?
http://video.nationalgeographic.com/video/science/technology-sci/gis_journey/

A geographic information system (GIS) integrates hardware, software, and data for capturing, managing, analyzing, and displaying all forms of geographically referenced information.

GIS allows us to view, understand, question, interpret, and visualize data in many ways that reveal relationships, patterns, and trends in the form of maps, globes, reports, and charts.

A GIS helps you answer questions and solve problems by looking at your data in a way that is quickly understood and easily shared.

Map Your Passion. Transform Our World.

We’re passionate just like you. Geography is at the heart of a more resilient and sustainable future and allows a deeper understanding of how we can positively impact the future. Together we can transform our world.

Features

Tell Your Story

Inspire action, connect with the public, and reach donors by telling your story with maps. Quickly combine location data, text, and multimedia to build interactive apps that highlight your work and advance your mission.

Monitor and Evaluate

Manage your operations, examine their efficiency, and provide transparency to donors. GIS provides operational awareness throughout your organization and analytics that support your decisions.

Collaborate with Others

Share your maps and data on your web pages, blogs, social media, and custom apps. ArcGIS Online gives you an easy-to-use and intuitive workspace for collaborating with others inside and outside your organization.

From Edutopia

Student Work: Street-Tree Inventory
Luis and his peers in the 4-H Tech Wizards program used personal digital assistants (PDAs) and geographic information system (GIS) technology to collect tree data and generate computerized maps for the City of Hillsboro Planning Department.
http://www.edutopia.org/digital-generation-technology-data-mapping

The Magic of Maps, GIS, the Wonderful World of Geography Awareness Week

SOCIAL JUSTICE AND DIGITAL EQUITY- SIG DE NOTES FOR NOVEMBER

Posted on November 9, 2012  Bonnie Bracey Sutton

I have always loved working with maps, globes and books.Now my learning is facilitated by the use of media and new ways of mapping. And then there is GIS. What is GIS? You use it in invisible ways. GIS.. here is a great video on it. GIS Day is on November 14, 2012.

Ask your elected officials to support funding for geography education.

Learn more about Geography Awareness Week

Geography Awareness Week there are a lot of online tools. There are things to use in your classroom, and a toolkit and a poster. You may want to start with this map tool. Free map kit.. and resources.

While studying at the National Geographic, I became involved in the study of geography. To study our neighborhood we collected various kinds of maps that showed the school community. We were located in Arlington , Virginia and we had a business map, a tourist map, a Virginia transportation map, a real estate map, and a map of historical places as well as a map that showed projections and plans for the future. That was before we all had our fingertips on technology to see this things online.  Children drew a map that showed the path from school to home. That was a fun exercise. The children were quite creative about making their personal maps. A person from USGS gave us maps of cities around the world, but they were not identified, they were in effect a view of cities from the air, New Orleans, New York, San Francisco, Cairo, Egypt, The Maldives, and other interesting places.

York, 

Pictures from an ESRI Conference to show every day resources original post in the ETCJournal

Here are some of the resources I used in an elementary program

Geography


Helping Your Child Learn Geography
A 32-page booklet, published in cooperation with the U.S. Department of Education and the National Geographic Society, that is designed to help adults stir children’s curiosity about geography. Includes many suggestions for simple activities. K-4.   Icon for classroom activities  Icon for lab resources
Map Adventures 
This on-line teacher packet for grades K-3 teaches basic concepts for visualizing objects from different perspectives and how to understand and use maps. The kit includes seven lesson plans, activity sheets, and a printable poster.   Icon for teaching module  Icon for classroom activities
What Do Maps Show? 
This on-line teacher packet for upper elementary and junior high school students has four lessons on reading and using maps. The packet includes a teacher’s guide, four printable activity sheets, and three maps in PDF format that can be downloaded and printed on 8.5″ x 11″ paper.   Icon for teaching module  Icon for classroom activities
USGS Geography Products
A list of online fact sheets, booklets, and educational resources related to geography and mapping.

The National Atlas of the United States


National Atlas of the United States®
This invaluable educational tool is a free, interactive version of the traditional paper United States atlas. Most information is designed to depict geographic patterns and trends on a national scale. Topics include agricultural use, forestation, population density, transportation, and more. Use the Map Maker tool to create custom maps or print one of hundreds of pre-formatted page-size maps that are excellent for classroom use. This is the best source for creating quick maps that cover large areas.   Icon for lab resources
Outline Maps of the United States – Printable Maps from The National Atlas
Download or print PDF files for several different outline maps of the United States, individual states, and counties within a state. Files print on 8.5″ x 11″ paper.Icon for lab resources
Latitude and Longitude – The National Atlas
Article describing latitude and longitude and related terms.

Topographic Maps


Topographic Map Resources for Teachers
An overall summary of useful USGS resources for working with topographic maps: where to get them; how to interpret them; how to use them; explanations of coordinates, datums, and projections; and lessons for the classroom. Also available as a 2-page PDF file.
Free Digital USGS Topographic Map Quadrangles
Download free USGS topographic map quadrangles in georeferenced PDF (GeoPDF) format by clicking on “Map Locator” on the USGS Store Web site. These files were created using high-resolution scans and average 10-17 megabytes in size.

You can participate, facilitate, learn using GIS.
GIS Day provides an international forum for users of geographic information systems (GIS) technology to demonstrate real-world applications that are making a difference in our society. We who use media on a daily basis use the tools of supercomputing , GIS and visualization and modeling without knowing it.

Never mind that geography and maps were not a part of my training for teaching. Geography?  We see the world in media almost daily. Sadly we do not necessarily teach our students formal geography.

I studied at the National Geographic I learned to read, study, analyze and ( fold a map). We had Map Maker Interactive. That is  an incredible piece of technology.I

You may need Inspiration. In a way students use some mind mapping programs to think about the world.

When I was a new teacher long ago, people often fought over the maps that were available in schools for students . There were these blue outline maps. They were limited in supply.

Here are some tools.

http://news.bbcimg.co.uk/media/images/63439000/jpg/_63439803_newcomp.jpg

State Interactive maps. You can investigate any state you want to explore.

One treasure chest of a site is MyWonderfulWorld.

interactive map. This is a homicide map of DC. You can check the homicides in your neighborhood. You may not want to know this big data, but in an emergency, it is big data that is collected to allow experts to assess the damages and know what to do.

Teacher? From the My Wonderful World Web Site.

10 Ways to Give Your Students the World

1. Show students that geography is everywhere.
It’s a global world, with people, ideas, and products moving rapidly around it. Today, how we live shapes, and is shaped by, where we live—and what happens in the natural environment. Find resources to build geography awareness in your school. Have your students test their Global IQ and practice withonline games.

2. Bring it up.
Is your school doing enough to prepare students for a global future and to tap into their natural curiosity about real-world issues, from the local to the global? (Find out with our school checklist). Start the discussion with other teachers, parents, administrators, and students. Spread the word about My Wonderful World to your colleagues and friends.

3. Find global connections close to home.
Have your students log their global connections over a period of time (a day, a week, or more): who they talk with, what they eat, what they wear, what they read, watch, listen to. Make maps and globes focal points in your classroom and use them often. Bookmark an online atlas or print out outline maps. Use posters, pictures, and other visuals to show global connections near and far.

4. Explore the planet using technology.
From free 2-D satellite maps to 3-D Earths, there’s possibility like never before to see our planet in new ways. And zooming into places can create a new perspective on how geography impacts current events. Learn about Geographic Information Systems (GIS) software and how it’s changing the way we explore.

5. Make geography part of every subject.
Every subject—from reading, writing, and arithmetic to science, economics, and foreign languages—can include geography. Use real-world examples and data (from sources such as the CIA World FactbookPopulation Reference BureauNational Park Service, or World Heritage Sites) when teaching other topics. When you can, use geography standards-based lesson plans. Prep students for the AP Human Geography test and urge them to take it. And make geography fun—enter your school in theNational Geographic Bee and other competitions.

6. Make it extracurricular.
Ask your parent-teacher organization to study the issue and devise ways to bring more geography learning into school. Enlist administration and parent leadership for evening or Saturday programs, festivals, competitions, field trips,geography/international clubs, and other events. And join your local geographic alliance to connect with peers.

7. Connect students with people from other countries and cultures.
More and more kids are using digital and online tools to interact with friends. Help them connect with peers overseas in order to practice languages, develop collaborative projects—even get to know time zones or the International Date Line. Check out programs from the ePalsPeace CorpsiEARN, and the Asia Society.

8. Help students envision their futures.
Many kids today will cross physical borders but even more will travel through technology. Inject geographic themes into career exploration. (Here’s a geography career guide; also one for GIS and one for international careers.)

9. Go there!
Remind yourself and your students that learning about new places and cultures is about exploration—you don’t always know the exact path to take or what you’ll find along the way. Take your kids on field trips and look for opportunities to seek adventure and educate yourself about the world firsthand. Consider study abroadfield researchteaching overseas, orgetting a grant to support new practices in your classroom. Hear international experts speak at your local World Affairs Council events.

10. Sign up for the My Wonderful World e-newsletter.
You’ll get helpful tips, the latest news, links to great resources and fun games, information about contests and offers, and much more. Sign up now—and help give your students the power of global knowledge.