Computational Thinking and Supercomputing!!

I have been learning about computers and technology for about 30 years or more. NASA, National Geographic, NEA, NSTA and the National Center for SuperComputing. Conferences, workshops, and meetings. It is a moving target. This blog is inspired by ex-students and CIrcl.

There is always more to learn, share and explore. Here is what might be of interest to you.

Here is some of the future of learning in a connected world.

Is your local school up to the challenge?Are you providing the real professional development for teachers?

SuperComputing and Computational Thinking (What do you know about it?)

In education, computational thinking (CT) is a set of problem-solving methods that involve expressing problems and their solutions in ways that a computer could execute..

Sounds and looks complicated? It is not. Digital Promise simplifies it like this.

But how do “code,” “computer science,” and, “computational thinking,” fit together? What is motivating their introduction into schools, and how might they change education?( read this report)

Digital Promise Our new report, Computational Thinking for a Computational World, draws from research and interviews with leaders around the country to answer the essential question: 

In a computational world, what is important to know and know how to do? Please download and read the report and share it.

Digital Promise says:

What is computational thinking?

Computational thinking skills are versatile approaches to problem solving that include:

  • Gathering and organizing data to investigate questions and communicate findings
  • Expressing procedures as algorithms (that is, a series of logical, precise, repeatable steps that delivers an expected result) to reliably create and analyze processes
  • Creating computational models that use data and algorithms to simulate complex systems
  • Using and comparing computational models to develop new insights about a subject

We see these practices of computational thinking ,benefitting cutting-edge research and everyday life.

For example, when a hurricane is approaching, a meteorologist on TV may use a computational model to demonstrate the various paths that the storm may take as any number of interdependent variables change.

An astrophysicist may similarly use computational thinking practices to develop simulations and new theories about the collisions of black holes.

Digital Promise shows us great images to understand the methodology.

There are great online resources, that are free that demonstrate how these skills are used.

The Science of Where

The Science of Where – Unlock Data’s Full Potential

https://www.esri.com/en-us/about/about-esri/overview

Will.i.am Sparks Mapping with GIS in L.A. Magnet Academy

What is Science On a Sphere®?

Science On a Sphere® (SOS) displays global data the way it should be viewed – on a sphere! It is a room sized, global display system that uses custom software, computers, and video projectors to display planetary visualizations (and much more!) onto a large sphere, analogous to a giant animated globe.

https://sos.noaa.gov/what-is-sos/what-is-science-on-a-sphere/

NOAA has an app !!

https://sos.noaa.gov/sos-explorer/download-sos-explorer-mobile/

Computational tools for high school STEM

https://ct-stem.northwestern.edu

In education, the acronym STEM stands for the disciplines of science, technology, engineering, and mathematics. STEM education, then, is the learning of these STEMsubjects through an integrated approach; one that offers hands-on and relevant learning experiences.

Students and robots intermingle at the Hirshhorn ARTLAB+

ArtLab is giving young people opportunities to explore science, technology, and art with help from innovative artificial intelligence (AI) robots.

Sometimes , the beginning of this learning path is coding!!!

We can find many ways to lean to do coding. Code.org has programs in many languages.

https://code.org

But don’t just do two weeks of coding. It’s something you can continue to learn and do projects in.


If you’re just getting started on your coding journey, here are ten tips and resources to set you off on the right foot.

Photo by hitesh choudhary on Pexels.com
  1. Grab Some Free Programming Books.
  2. Take a Coding Course. … 
  3. Use Free Online Training Sites. … 
  4. Try a Kids App. … 
  5. Start Small (and Be Patient) … 
  6. Choose the Right Language. … 
  7. Figure Out Why You Want to Learn to Code. …

Stay tuned for part two.

Code.org® is a nonprofit dedicated to expanding access to computer science in schools and increasing participation by women and underrepresented minorities. Our vision is that every student in every school has the opportunity to learn computer science, just like biology, chemistry or algebra. Code.org provides the leading curriculum for K-12 computer science in the largest school districts in the United States and Code.org also organizes the annual Hour of Code campaign which has engaged 15% of all students in the world. Code.org is supported by generous donors including Amazon, Facebook, Google, the Infosys Foundation, Microsoft, and many more.

Studying the Human Body ,Is Virtually a Whole New Experience!!

Those of us who started teaching before technology took hold had some hard lessons to teach. Talking about most of the human body was not correct. ( sex) and then to explain the systems. What a job! What was allowed, and what permission did we have?

This is the Me Too Era… there are more resources and perhaps extended permission. We think in new ways about teaching about the human body.
human-anatomy

My friend Delores Davis had each child to use brown wrapping paper in large sizes to make a body. The systems we were allowed to teach were then carefully draw and attached to the brown paper ” body”. And we learned to take a pulse , measure height and weight ,to talk about nutrition.

person using black blood pressure monitor

Photo by rawpixel.com on Pexels.com

I taught from the inside out. I loved using skeletons of small animals that were dis-articulated to have students think about their skeletal structure. Of course I did it around Halloween. One year my brother, who was studying to be a physician brought a whole skeleton to the study.

selective focus photography of skeleton

Photo by Chris Mitchell on Pexels.com

I had a cat, skeleton, a rabbit skeleton, a snake skeleton and a mounted chicken skeleton.

The bones were in boxes and we had a blue velvet sort of box to make the display.

Reading about the human body does not tell you much.  A nurse could come in and talk.

The Red Cross helped us with some little charts to teach about the circulatory system.

And there was a lung that smoked to show children the effects of smoking.

008

INTERACTIVE DISPLAYS

The Franklin Institute in Philadelphia has a walk through heart. There is also an exhibit 

that goes to communities for the study of the heart.

Museums did a great visualization job in sharing the body systems.

Now there is online BioDigital, and there are many other iterations of ways to study and learn about the human body. You have to establish an account to take a look but it does not cost anything.

The BioDigital Human visualizes anatomy, disease and treatments in interactive 3D.

Some question the use of VR because it requires different teaching strategies. Here is an article that shares those concerns.

Common Sense has reviewed and commented on applications for K-12.

Best Anatomy Apps and Websites for Students

computer desk laptop stethoscope

Photo by Negative Space on Pexels.com

Learning anatomy and physiology can be tough for students, especially at higher levels; not only is there a lot to remember, but it can be difficult to comprehend how the body systems all work together.

As students dive into the organs of the respiratory or digestive system, they’ll gain an appreciation for structure and function, and they’ll understand how our anatomy influences our health and the medical field.

Give Gray’s Anatomy a rest with these picks that provide some amazing interactive models, let students perform virtual dissections on animals, and reveal every detail of the human body.

https://www.commonsense.org/education/top-picks/best-anatomy-apps-and-websites-for-students

For younger students ( 3-8) There is Tiny Bop ! It is an app.

Immune Defense

Immune Defense is a strategy game for big kids and grown ups (ages 10+). Players use various types of white blood cells to fight off real pathogens, using real surface molecules and signaling molecules. More information about Immune Defense here.
Available for PC, Mac and Linux computers. The video is here.

SEX EDUCATION?

Harvard takes us to new levels with this curriculum in sex education. (from the article)

“Sex education in America is still often taught as abstinence-only, despite decades of research showing that this approach results in higher teen pregnancy rates and STDs. Absent a more complete sex education — or any at all — children often learn from peers, siblings, or the internet, Brown tells EdCast, opening the way for misinformation and a lack of understanding of what is and isn’t appropriate when it comes to respect in sexual relationships. Students need to be prepared for the world we live in and become part of a broader conversation about “communication, intimacy, desire, and healthy relationships,” Brown says.”


Although the federal government has moved to reduce access to intervention tools such as sex education, there’s also some good news: Many states, fueled by the #MeToo movement, are taking initiative to make change, Brown says. “#MeToo is the catalyst for better consent and sex ed in schools and states around the country,” she says, citing Georgia, Illinois, Missouri, and Maryland as states that have updated laws to include consent.

https://www.gse.harvard.edu/news/uk/18/12/state-sex-education#.XDe-v4oh1bg.twitter

Welcome to the future.

Study the human body

The Future of Education
Teaching and learning have gone beyond the norms of reading from a book. With the Virtual Reality technology, students are able to better understand concepts at a much profound level.


Cooking Up STEAM, by Bites and Bytes,YUM!

Delicious Doings in the Classroom or After School Program!!

Mucca - Learning about the Cow and Milk

Hands on Learning

Many of us have had a fascinating whirl on the Internet learning about foods,recipes and ways to involve the joy of cooking, or eating.

I like this site.   http://www.exploratorium.edu/cooking/  

You can discover how a pinch of curiosity can improve your cooking! Explore recipes, activities, and Webcasts that will enhance your understanding of the science behind food and cooking. No need for package services to deliver ideas to you.

anise aroma art bazaar

Photo by Pixabay on Pexels.com

It has in the “Science of Cooking”, sections on candy, bread, eggs, pickles , meat, and seasonings.

cream with jelly on top

Photo by Snapwire on Pexels.com

CANDY

BREAD

Person Holding Egg

EGGS

PICKLES

Variety of meat products including ham and sausages

MEAT

The series of live Webcasts explores the science and culture of cooking. The guests include noted chefs, food chemists, and nutritionists, and they take field trips to investigate famous kitchens and farms!


dn0g3uk8jbb5ikzxll2j

National Geographic taught us how to think about the way in which foods traveled to our world. There used to be a lesson on a Chocolate Bar. ( How it Becomes a Chocolate Bar_)

Here is that lesson. http://www.iupui.edu/~geni/documents/Worldinacandybar.pdf

Here is a story of chocolate, a kind of story map. http://www.magnumicecream.com/us/en/the-history-of-chocolate.html

                              INVOLVING FAMILIES , and COMMUNITY

I like to get recipes from the class, and sometimes I would have a potluck dinner and parents and I would make a class cookbook. Each student brings in a special family recipe and when compiled together, you have a class cookbook.  I was lucky to have parents who wanted to be a part of helping to teach the Accidental Science of Cooking.

My classes were multicultural. My school had grants that were given to teachers for classroom work. The county also funded projects. With the funding our class got utensils, pots and pans , a two burner hotplate ,and a convection oven. Cooking was gently inserted into the curriculum. STEM, STEAM, whatever.

National Geographic has this :

https://www.nationalgeographic.org/media/matter-taste-wbt/


There was also a Kidsnetwork  NGKN unit on Nutrition and “What are We Eating”.

A great starting point. 

Planet Food

The Planet Food interactive aggregates the contents of your meal to generate a map showing the global footprint your plate makes before it even gets to your plate, and puts you in charge of the world wide journey a bar of chocolate will take before it gets to you.

PLANET FOOD

Welcome to Planet Food. Win lots of virtual badges by completing challenges that get you thinking about where food comes from, and how it gets to your table.

Eat: The Story of Food

Documenting dinners around the world. 

These days, documenting our dinners for the Internet is a universal pastime: sharing your food means that you don’t dig into your plate until you’ve taken a picture of it with your phone and posted it to your social networks. National Geographic gives us photos from around the world.

It is easy on the Internet to look at pictures of food.  Families , schools and communities often come together to explore, examine, and eat food.


There are these wonderful areas to explore and tailor to your programs

My favorite is the accidental science of cooking 

The program is from the Exploratorium in San Francisco.
Discover how a pinch of curiosity can improve your cooking! Explore recipes, activities, and Webcasts that will enhance your understanding of the science behind food and cooking.


At the Department of Educations Game Expo I found Chef KOOCHOOLOO


After School Programs

Chef Koochooloo’s after school program blends humanity’s oldest means of socialization—cooking and eating together—with its most modern lessons. Their master chefs lead classes leveraging  iPad applications, framed around recipes from a specific country or culture. As they prepare food together, kids learn about cooking-related math and science skills, and social-responsibility. Additionally, we emphasize healthy cooking techniques. Most after school sessions are one hour long, unless the school requests a two hour program. Their teachers have been trained in food safety and culinary arts. Each classroom experience includes a food science experiment, and a fun unique geography lesson.

Their mission is to excite kids by discovering the world through healthy, collaborative cooking classes, enriched with STEAM (science, technology, engineering, arts, and mathematics learning). Their vision, to improve the health, happiness and education of children worldwide, through dynamic curriculum and engaging gamified technology.

There is an APP for that. Chef KooChooloo !!


  Go Graphic, Story Map

A fun thing to do is to have students map how a food got to America, building a story map from ESRI. Here is where to start.

MAKE A STORY MAP


adult book business cactus

Photo by rawpixel.com on Pexels.com


                                                            USING ESRI TOOLS

Start telling stories here. https://storymaps.arcgis.com/en/my-stories/

Some outcomes that I had were unexpected. Families helped my class to build a classroom garden. There were grants that we found , one parent turned over the earth and started us growing. I had quick learning to do.pexels-photo-704818.jpeg


Another small miracle is that we began to grow herbs. A parent brought us plants which we put in the school window. Francesco De Baggio, shared with the class how to raise herbs in the classroom windows.

That was a big hit. I had never used fresh herbs. Not being Italian, I did not know that much about pasta either. It was a fun learning journey.

IMG_1773

You need a grant?https://www.nationalgeographic.org/grants/


The Internet of Things,Part 2

unsetinternet-things-iot-word-icons-globe-world-map-dotted-51758679


I have spent time at NIST studying the Internet of Things since my last post on it. There are some new things to share including this video from the National Institute of Standards. NIST.

What is the Internet of Things (IoT) and how can we secure it?

Video https://cdnapisec.kaltura.com/index.php/extwidget/preview/partner_id/684682

So you may think well what has that got to do with me? I don’t care about IoT is what a lot of people say initially until they learn more.

Oh Yawn…some would still say!

How about this headline?

A company that sells “smart” teddy bears leaked 800,000 user account credentials—and then hackers locked it and held it for ransom.

https://motherboard.vice.com/en_us/article/pgwean/internet-of-things-teddy-bear-leaked-2-million-parent-and-kids-message-recordings

Internet of Things Examples

Mostly people care about personal uses:

These are a few of the examples on the link

Remember to take your meds

Monitor an aging family member

Check on the Baby

Stay Out of the Doctor’s Office

11053572_10153352643151327_5344661201167810449_n

YOUR CITY

Engage with the data exhaust produced from your city and neighborhood

Light streets more effectively

Monitoring flooding

There are many  examples to show how IoT can affect you personally.

internet-of-things


In the next century, planet earth will don an electronic skin.
It will use the Internet as a scaffold to support and transmit its sensations.” – Neil Gross 1999


IoT solutions can be built for large amount of application areas. In manufacturing industry sector even a new concept has been created to describe the new generation IoT enhanced manufacturing: Industry 4.0. IoT can essentially improve manufacturing process monitoring, analyzing, optimizing and managing. In healthcare sector wristbands connected with smartphones can tell heartbeat rate, steps taken and sleep pattern to encourage healthier behavior. Energy consumption of buildings can be controlled intelligent ways. There are even developed fridges which can send the content information to the user’s mobile phone.

In logistics IoT is widely in use and will spread to new logistics application areas in the future. Traffic infrastructure has lots of data collecting points. This data can be used to help traffic control centers and infrastructure users to have real-time information on congestions, weather conditions, accidents etc. Vehicles’ and vessels’ movements can be monitored by location technologies and forwarded as estimated time of arrivals for the waiting customers. Load space and cargo temperatures can be remote monitored and if exceptions arise, the drivers or other users will be notified.

One of the most advanced new logistics IoT solutions is for waste collect transportation. The garbage bins have sensors which measure the free capacities of the bins. The system calculates the predicted time when the bin should be emptied. This information is sent to the route optimization program which produces the schedules and routes for the garbage truck drives.

Maintenance needs and driving of vehicles, forklifts and cranes can be monitored by IoT. Measuring can produce information on economical driving, safety, failures, performance etc. Based on this information the amount and models of machines or vehicles can be optimized, safer driving can be enhanced, work tasks can be optimized and many other improvements can be reached. Also emissions reducing have a big role and there is a need to collect reporting for greener logistics. Congestions increase harmful emissions and waste time – the data collected from navigators can dynamically produce alternative route options for users to select less crowded roads.

There have been large tests to monitor sea containers using boxes which can send for example location, temperature, humidity, movement shocks and door opening data to the shipment controller. This data helps with operation scheduling and risk management. There have been also pilot application where food packages have had sensors to monitor possible contamination risks. The sensor communicates with the back-end system using radio waves (rfid tag) and RFID technology is one the key enabling technologies in logistics IoT solutions.

Sensor systems can produce data several times per second, thus cumulating data amounts can become very large. Sometimes it’s reasonable to use big data –methods to store, handle and analyze data. Also the role of artificial intelligence technologies can help to find relevant information from IoT data. For example heart health can be evaluated using ECG curve analysis and instead of doctor the interpretation of the curve is done by intelligent algorithms. IoT applications can be taken into use as cloud solutions where the users see reporting results using web or mobile applications. Different kind of technical IoT platforms, devices and ecosystems have also developed rapidly and building applications is now faster and easier than in the past. On the other hand security risks have become real challenges because many IoT solutions were originally thought to be used in closed network and not in open Internet. Source;

Internet of Things – IoT

Oh Boring…some would still say!

Look at Education for the Future. We need to be aware of the excellence of ideas but also help oarrents and caregivers monitor and manage the relationship that their families have with media.

IOT is already here.iho

NCTA  

Click the link above!!


Indigenous People’s Curriculum Day and Teach-In


img4

It is almost the month and day when people celebrate Columbus Day. The D.C. Area Educators for Social Justice a Project of Teaching for Change ,offered a workshop that has resources that you can use.

We engaged with curriculum and strategies for teaching students about Indigenous People’s history and life today.

You can explore the collections and learn about the features of the  museum here.

 I chose to attend this topic, first.

Trail of Tears

                                    What Does it mean to Remove a People?

We learned about the US Government’s American Indian removal policies of the 19th century and their lasting  effects on Native nations. We used Native Knowledge 360 in a guided lesson using documents. map, and multimedia resources.

The case study is here.

                  Potawatomi Nation Case Study

How did members of the Potawatomi Nation, who originally lived in Michigan, end up living in Oklahoma? Sources allow you to further investigate this story of American Indian removal. There is an online  treaty, map, document , quotes, and an object to study and think about this case. You  don’t have to use technology to explore this but it is easier. You can request that the paper copies be mailed to you.

We used both paper and the online resources so the attending teachers could explore and examine both ways of teaching the lesson.

Image may contain: 1 person

The real history of the Americas has been lost by trivialization and by being omitted from the textbooks.

We have new tools to teach with and ways to access information. We have groups who want to tell the real story of the Indigenous . Who are the Indigenous ? Wikipedia says”Indigenous peoples, also known as first peoples, aboriginal peoples or native peoples, are ethnic groups who are the original inhabitants of a given region, in contrast to groups that have settled, occupied or colonized the area more recently. Groups are usually described as indigenous when they maintain traditions or other aspects of an early culture that is associated with a given region. Not all indigenous people share this characteristic, usually having adopted substantial elements of a colonising culture, such as dress, religion or language. Indigenous peoples may be settled in a given region (sedentary) or exhibit a nomadic lifestyle across a large territory, but they are generally historically associated with a specific territory on which they depend. Indigenous societies are found in every inhabited climate  zone and continent  of the world.[1][2]


https://mashable.com/article/indigenous-map-america/?utm_cid=mash-com-fb-main-link#V0V5kYZOYaqG

To teach about the Indigenous people of the Americas, we go to the National Museum of the American Indian. Or we learn with the people, visiting and listening to their stories.

To learn from the Smithsonian you can just log into the site. There are many resources.

                                     CARETAKERS OF THE EARTH

My second workshop of the eight offered was “Caretakers of the Earth: Continuin the Legacy in Elementary Classrooms.

We created a colorful collage book showing the life of the American Shad fish and the importance of shad to inland waterways and to local Native peoples such as the Pamunkey and Mattaponi. This activity provided the opportunity for showing students how we can each take action to improve our environment

814552da-11b5-46f5-b547-a4760d3efa01-collage


The newest one is the 360 site using it as a tool. Native Knowledge http://nmai.si.edu/nk360/, Here are new perspectives on Native Americans. From the site,

                        About Native Knowledge 360°

Native Knowledge 360° (NK360°) provides educators and students with new perspectives on Native American history and cultures. Most Americans have only been exposed to part of the story, as told from a single perspective through the lenses of popular media and textbooks. NK360° provides educational materials and teacher training that incorporate Native narratives, more comprehensive histories, and accurate information to enlighten and inform teaching and learning about Native America. NK360° challenges common assumptions about Native people—their cultures, their roles in United States and world history, and their contributions to the arts, sciences, and literature. NK360° offers a view that includes not only the past but also the richness and vibrancy of Native peoples and cultures today.


Lessons & Resources are here. 

Explore featured educational resources, below, or search all educational resources using the search tool. Many of these resources are also available in print. Use the teaching materials order formto order print versions.

The museum and the DC Area Educators for Social Justice sponsored this event.

Plains Nations' pipes and pipe bags

The museum offers professional development for educators.
history, cultures, and contemporary lives. It is a powerful tool.

                               The Campaign to Abolish Columbus Day

              https://www.zinnedproject.org/campaigns/abolish-columbus-day

Rethinking Columbus: The Next 500 Years (Teaching Guide) | Zinn Education Project: Teaching People's History

It is time to stop celebrating the crimes of Columbus and stand in solidarity with the Indigenous people who demand an end to Columbus Day. Instead of glorifying a person who enslaved and murdered people, destroyed cultures, and terrorized those who challenged his rule, we seek to honor these communities demanding sovereignty, recognition, and rights. We encourage schools to petition their administration and for communities to introduce legislation to rename Columbus Day to Indigenous Peoples Day. Below we provide information and resources to join the campaign to Abolish Columbus Day.

Resources here Abolish Columbus Day Packetimg_0797

Toward Responsiility: Social Studies Education that Respects and Affirms Indigenous Peoples and Nations. HERE  A Position Statement of National Council for the Social Studies
Approved March 2018

 Commit to responsible representations. The rampant misrepresentation of Indigenous peoples in the media and popular culture contributes to continued settler colonization and racism toward Indigenous Peoples . Social studies education specifically needs to address how the presence of stereotypes in school settings  ( e.g.Native mascots), teaching materials ( e.g. Hollywood movies) and the wearing of costumes during the school  day ( e.g. Halloween parties, Thanksgiving lessons)reinforce overgeneralization and false understandings of Indigenous peoples. Such misrepresentations harm Indigenous peoples. Such misrepresentations harm Indigenous students,  negatively impacting their self-esteem, while at the same time giving non-Indigenous students a “psychological boost” and false sense of superiority. Responsible representation first requires that educators that educators counter racist stereotypes , misrepresentations and caricatures of Indigenous lief. ( e.g. that all Indigenous people live in tipis or go to pow wows, that Native communities are “stage/uncivilized” or “lazy). Following this, educators must also emphasize the diversity of of Indigenous peoples and nations, utilize diverse representations of Indigenous life ( e.g. Indigenous leaders, athletes, authors, artists) , use specific names of Indigenous People and Nations ( e.g. Indigenous leaders, Navajo or Dine: Iroquis or Haudenosaunee Confederace : Seminole Nation of Oklahoma, Nottawaseppi Huron Band of the Potawatomi) and focus on the contemporary people and issues.

Teach Current events and movements. The growing movement by the Standing Rock Sioux Nation and hundreds of other Indigenous Nations to protect their homelands and resources from destruction presents teachers an opportunity to introduce students to lessons based on the environment, government, history, economic, cultural studies and civics.


img_3541


Thinking of Hawaii

The state of Hawaii is in the news everywhere these days.lava-magma-volcanic-eruption-glow-73830.jpeg

It was the second on my wish list to travel to as a teacher. I knew a lot about Hawaii because of its flowers. I love tropical flowers. But I was also interested in volcanology. Fortunately the Challenger Center Workshop presenters were awarded a workshop on the Big Island, right there in Volcanoes National Park.


The status and summary, updated. Updated news about Hawaii

Where is Hawaii?

What island are we talking about ?

What is happening? What do we know?

When I taught back in the day ,there was this movie, that we had to share with students that shared the last big eruption of the volcano. Here is a map to show which island and the location of the flow. The state of Hawaii is several islands and is still expanding. We did not have GIS or live photos like these.

If you have access to Science on a Sphere, you can easily learn

plate tec·ton·ics
noun
  1. a theory explaining the structure of the earth’s crust and many associated phenomena as resulting from the interaction of rigid lithospheric plates that move slowly over the underlying mantle.

This is a project in some schools , museums and public places that will teach you earth science. The ring of fire is what we use to tell about volcanology.

It is here.

In learning places like museums, schools and community centers you might be able to learn about plate tectonics with a hug globe on which images are projected.iuri

The tools that we have now to explore and learn about earth science are fantastic.

There is a laptop version. It is called Explorer

What is SOS Explorer?

Hilary

Hilary Peddicord uses SOSx in the single screen
mode at Casey Middle School in Boulder, CO

SOS Explorer (SOSx) is a flat screen version of the widely popular Science On a Sphere® (SOS). The revolutionary software takes SOS datasets, usually only seen on a 6-foot sphere in large museum spaces, and makes them more accessible. Animated images such as atmospheric storms, climate change, and ocean temperature can be shown in SOSx, which explains sometimes complex environmental processes in a way that is simultaneously intuitive and captivating.

NOAA uses SOSx as an instrument to highlight and disseminate cutting edge science to the world through visualizations that show information provided by satellites, ground observations and computer models.

Features Include:

  • Easy to use touchscreen interface for maximum interactivity
  • Over 140 datasets, including real-time datasets with descriptions
  • Educational videos linked to specific datasets for deeper inquiry
  • Tours that create a narrative through the datasets and help users make connections
  • Analysis tools to easily measure, probe, and plot data from the visualizations
  • Immersive, first person experiences: walk on the Moon, pilot a submarine, or take cover from a tornado
  • Stunning graphics in beautiful 4k resolution
  • Dual screen or single screen configuration options
  • SOSx Tour Builder that allows for the addition of new datasets and the creation of tours
  • Virtual Reality add-on
  • 360 degree video content
  • International language support
  • Compatibility with interactive projectors, screens, tables, and smartboards

GIS 1

Lots of people want to know how to make it Science, Technology. Engineering and Math. The lessons here are incredible for the Explorer program. You can learn using GIS from ESRI very well. The story maps are quite interesting and students could use the newspaper articles to create their own story maps. Here is an exercise for students to complete. In this exercise the student uses data to evaluate. This personalizes the experience. The students have to T H I N K and use data. I love this lesson.

When a volcano erupts, how much time do residents have to evacuate? That depends. Lava flows downhill and travels faster over steep ground. In the early 1990s, residents of Kalapana, a town in the southeastern Puna region, had days or even weeks to prepare for a lava flow that eventually covered the town. By contrast, a 1950 lava flow down the western flank of Mauna Loa reached the sea in about four hours. Although scientists monitor ground movement on the island continuously, there is no way to know how much advance notice residents living downhill of an eruption will receive.

In this lesson, you’ll begin to explore the relationships among lava flow zones, emergency shelters, and population. By the end, you’ll be ready to ask some questions that you’ll answer in the remaining lessons.


Explore the data and ask questions

When a volcano erupts, how much time do residents have to evacuate? That depends. Lava flows downhill and travels faster over steep ground. In the early 1990s, residents of Kalapana, a town in the southeastern Puna region, had days or even weeks to prepare for a lava flow that eventually covered the town. By contrast, a 1950 lava flow down the western flank of Mauna Loa reached the sea in about four hours. Although scientists monitor ground movement on the island continuously, there is no way to know how much advance notice residents living downhill of an eruption will receive.

Hawaiian folklore and art are interesting to link to the lessons.  So is thinking about walking through a lava tube. What is it? What should it be like inside? Why is it called a lava tube? How long are they, and where can they be found? Why does NASA use them for training?No automatic alt text available.

You can see my Volcano National Park Tour here. I will add  text to the pictures. Madam Pele has many stories . I don’t think I know them all. There is music and incredible dance.

No automatic alt text available.

The Internet of Things!

child Headhttps://www.nist.gov/topics/internet-things-iot

The Internet of Things has been around for a while. The knowledge of it has not. Some of us laughed when Alexa was introduced on SNL because we understood that most people were not ready for her or SIRI.

What is Alexa and what does it do?
Amazon Echo (shortened and referred to as Echo) is a brand of smart speakers developed by Amazon.com. The devices connect to the voice-controlled intelligent personal assistant service Alexa, which responds to the name “Alexa“. This “wake word” can be changed by the user to “Amazon”, “Echo” or “Computer”.
Smart speakers are two way. They intake information and pass it back to a network.
People started paying attention outside of industry when this happened.

Teddy Bear gives up personal data

Privacy people raised the alarm but educators were not ready for IoT. Here is why privacy people ran up the red flag. Privacy Concerns about AI, Mattel

Security concept: Privacy on digital background

Security concept: pixellated words Privacy on digital background, 3d render

IoT – from Internet of Things to Internet of Transformation

Virtually everyone knows that IoT stands for (the) Internet of Things and that it has something to do with connected things.
Yet, what can you do with “it”? What is IoT really about? And what does it have to do with transformation?

IoT is the popular acronym for Internet of Things. The IoT refers to the networking of physical devices such as objects and devices which are attached to living creatures, including humans.

These objects contain embedded technologies, can be uniquely identified via an IP address, and are able to sense, gather, collect and send data.

The potential and reality of the IoT does not lie in the ability to connect IoT-enabled objects nor in the embedded technologies and electronics such as sensors, actuators and connectivity capabilities. It resides in the ways the IoT is used to leverage the insights from data, automate, digitize, digitalize, optimize and in more mature stages transform processes, business models and even industries in a scope of digital transformation.

source

https://www.i-scoop.eu/

The Internet of Things Cybersecurity Improvement Act’: Unlocking the Value of the Industrial Internet of Things – Moving from Promise to Reality 

The Internet of Things Cybersecurity Improvement Act was introduced by a bipartisan group of Senators in August 2017 in response to several attacks spread via networks of infected IoT devices over the past year. The bill, which has been widely welcomed by stakeholders on all sides, is an attempt by legislators to establish minimum security requirements for federal procurements of connected devices, and work towards addressing the significant security challenges posed by the release and spread of insecure internet-connected devices. This session will explore the bill’s requirements and aims, and debate whether it goes far enough. It will look at areas in which possible clarifications may be needed; and examine challenges and opportunities that it may create for stakeholders on both federal agencies procuring goods and services; and the companies providing them. Ultimately, it will look at the extent to which it is likely to meet its objective of helping to create a more secure digital environment.

• What impact is the bill likely to have in helping to address security challenges posed by IoT and does the bill go far enough to ensure Internet of things devices used by federal agencies consistently meet enhanced security standards?
• What does the bill consider as the definition of ‘Connected devices’ and the scope of research exemption, and is there any clarification needed here? Does the legislation need to look further into mandating user behavior?
• What technical and competitive opportunities would this bill, if enacted, concretely represent to manufacturers of connected devices? What challenges may they face and how could these be overcome?
• How can it be ensured that the bill doesn’t hinder innovation in the IoT space? Should a country of origin-based limitation on purchase and storage be considered?
• What support may vendors need to make the required investments to further secure their IoT offerings?
• To what extent will the challenges related to the practical enforcement of this legislation be addressed?
• Although the proposed bill only applies to technology firms and contractors selling products to federal agencies, to what extent can it be expected to extend into private sector guidelines moving forward?
• What opportunities does the bill represent for cyber researchers and white-hat hackers, and to what extent will further cooperation between researchers and vendors be encouraged? Show less

https://www.nytimes.com/2015/09/06/opinion/sunday/allison-arieff-the-internet-of-way-too-many-things.html?action=click&pgtype=Homepage&module=opinion-c-col-left-region&region=opinion-c-col-left-region&WT.nav=opinion-c-col-left-region&_r=1


“Connected devices using the Internet of Health Things are beginning to transform healthcare delivery. By introducing more connectivity, remote monitoring and information gathering, IoHT can encourage better use of healthcare resources, more informed decisions, a reduction in inefficiencies or waste and the empowerment of health consumers.”


IoT is a concept based on creating systems that intera ct with the physical world using networked  entities (e.g., sensors, actuators, information resources, people).

 There can be confusion around the meaning of the term “ Internet of Things ” for a variety of  reasons. They include: the cross -cutting aspect of IoT (specifically with respect to application  domains) ; the multitude of stakeholders involved in IoT and their specific use cases ; the complexity of IoT ; and the rapidly changing technology supporting IoT.  While there is no universal definition of IoT, common elements exist among the many high- level 325 definitions and descriptions for IoT. The Internet of Things consists of two foundational concepts:  IoT components are connected by a network providing the potential for a many -to-many 330 relationship between components (this network capability may or may not be TCP/IP based) ; and some of the IoT components have sensors and actuators that allow the components to interact with the physical world

NIST created a video for use and learn about it and cybersecurity.


nist-cybersecurity-and-internet-things

What is the Internet of Things?dtn-ssi

The Internet of Things?

The Internet of Things is the network of physical devices, vehicles, home appliances and other items embedded with electronics, software, sensors, actuators, and connectivity which enables these objects to connect and exchange data.Wikipedia

Internet of Things is a concept that increasingly takes more relevance.

It is a term that we hear constantly. Internet of Things or IoT, is an abstract concept but has been gaining quite a popularity in recent months. Everyday things that connect to the Internet, is a simple concept but in reality is much more than that.

If we were to give a definition of IoT probably better to say that it’s a network that connects physical objects to the Internet

IoT is not new at all. For about 30 years we have been working with the idea of making everyday objects more interactive.internet-things-iot-word-icons-globe-world-map-dotted-51758679


Beginner’s Guide for Understanding the Internet of Things


internet-of-things

America’s Schools are Profoundly Unequal! A Whole lot of Education Information


15421006_10154621210371327_254228138370067503_nHave you seen?

The report on Unequal Schools from the Civil Rights Commission

“The federal government must take bold action to address inequitable funding in our nation’s public schools.”

So begins a list of recommendations released Thursday by the U.S. Commission on Civil Rights, an independent, bipartisan agency created by Congress in 1957 to investigate civil rights complaints. Thursday’s report comes after a lengthy investigation into how America’s schools are funded and why so many that serve poor and minority students aren’t getting the resources they say they need.

The 150-page report, titled “Public Education Funding Inequity: In An Era Of Increasing Concentration Of Poverty and Resegregation,” reads like a footnoted walking tour through the many ways America’s education system fails vulnerable students — beginning with neighborhood schools that remain deeply segregated and continuing into classrooms where too many students lack access to skilled teachers, rigorous courses and equitable school funding.

“This report excavates the enduring truism that American public schooling is, and has been, profoundly unequal in the opportunity delivered to students, the dollars spent to educate students, and the determinations of which students are educated together,” writes the commission’s chair, Catherine Lhamon.

History lesson

The first two-thirds of the commission’s report is essentially a history lesson on the decades-old fight over equitable school funding, so we’ll start there, too. The fight arguably began in 1954 with Brown v. Board of Education and the Supreme Court’s decision that “separate but equal” schools for black and white students were anything but equal.

In 1965, President Lyndon Johnson waded into the debate, arguing that the federal government should send money to school districts that serve low-income families. Congress agreed, creating Title I. In the 2014-15 school year, states received more than $14 billion in Title I money.

To this day, though, states are all over the map when it comes to how equitably they spend their own money in schools. The problem was baked into the system from the beginning, with local property taxes being an important driver of both school funding and of inequities in school funding.

“This is America,” writes Karen Narasaki, a member of the commission. “Every child deserves a quality education that does not depend on their ZIP code.”

To make that happen — many states now use state tax revenue to try to even out those local imbalances, some more effectively than others.

We are a  ‘Nation of Opportunity, and the present time points us toward the future.

There are groups that hope to change the way we learn by mentoring, by sharing, by participatory involvement at national, regional and local levels. School boards are often the passport to change. The National Science Foundation funds innovation and research.

Communities within groups like ISTE and CoSN help to drive change.They publish guides like

No Fear Coding

Computational Thinking Across the K-5 Curriculum

he people most affected by the inequality may not be a member or these groups trying to help them.

CoSN the Consortium for School Networking has action for members and reports such as this as well. AccessibilityToolkit.  

CoSn also publishes the Horizon Report on an annual basis.

NMC Horizon Report 

2017 Higher Education Edition

The NMC Horizon Report > 2017 Higher Education Edition is a collaborative effort between the NMC and the EDUCAUSE Learning Initiative (ELI). This 14th edition describes annual findings from the NMC Horizon Project, an ongoing research project designed to identify and describe emerging technologies likely to have an impact on learning, teaching, and creative inquiry in education. Six key trends, six significant challenges, and six important developments in educational technology are placed directly in the context of their likely impact on the core missions of universities and colleges. The three key sections of this report constitute a reference and straightforward technology-planning guide for educators, higher education leaders, administrators, policymakers, and technologists. It is our hope that this research will help to inform the choices that institutions are making about technology to improve, support, or extend teaching, learning, and creative inquiry in higher education across the globe. All of the topics were selected by an expert panel that represented a range of backgrounds and perspectives. View the work that produced the report on the official project wiki.
CIRCL  takes us into the future using Cyberlearning.

New to Cyberlearning? Get started here.

New technologies change what and how people learn. Informed by learning science, cyberlearning is the use of new technology to create effective new learning experiences that were never possible or practical before. The cyberlearning movement advances learning of important content by:

  • Applying scientific insights about how people learn
  • Leveraging emerging technologies
  • Designing transformative learning activities
  • Engaging teachers and other practitioners
  • Measuring deeper learning outcomes
  • Emphasizing continuous improvement

 
2018?Horizon Report Update 2018

I am a pioneer in technology and use these sites to keep up. What do you and your communities use?

                                              What about ACCESS?

While the nation continues to make progress in broadband deployment, many Americans still lack access to advanced, high-quality voice, data, graphics and video offerings, especially in rural areas and on Tribal lands, according to the 2016 Broadband Progress Report adopted by the Federal Communications Commission.

Section 706 of the Telecommunications Act of 1996 requires the FCC to report annually on whether advanced telecommunications capability “is being deployed to all Americans in a reasonable and timely fashion,” and to take “immediate action” if it is not.  Congress defined advanced telecommunications capability as “high-quality” capability that allow users to “originate and receive high-quality voice, data, graphics, and video” services.

In the Report, the Commission determines that advanced telecommunications requires access to both fixed and mobile broadband services because more Americans use mobile services and devices to access the Internet for activities like navigation, communicating with family and friends and on social media, and receiving timely news updates away from home.  The Commission also retains the existing speed benchmark of 25 Mbps download/3 Mbps upload (25 Mbps/3 Mbps) for fixed services, but finds that the current record is insufficient to set an appropriate speed benchmark for mobile service.

While the Commission finds that it is reasonable to apply the same speed benchmarks to all fixed services, including fixed terrestrial and fixed satellite broadband service, the Commission continues to observe different technical capabilities and adoption patterns between fixed terrestrial and fixed satellite service.  Because no fixed satellite broadband service meets the 25 Mbps/3Mbps speed threshold as of the reporting period, the Report does not address the question of whether fixed satellite broadband services meeting this speed threshold would be considered to provide advanced telecommunications capability.

Significant progress in broadband deployment has been made, due in part to the Commission’s action to support broadband such as through its Universal Service programs. However, the Commission finds that these advances are not enough to ensure that advanced telecommunications capability is being deployed to all Americans in a timely way.

Key findings include the following:

  • 10 percent of all Americans (34 million people) lack access to 25 Mbps/3 Mbps service.
  • 39 percent of rural Americans (23 million people) lack access to 25 Mbps/3 Mbps.
    • By contrast, only 4 percent of urban Americans lack access to 25 Mbps/3 Mbps broadband.
    • The availability of fixed terrestrial services in rural America continues to lag behind urban America at all speeds:  20 percent lack access even to service at 4 Mbps/1 Mbps, down only 1 percent from 2011, and 31 percent lack access to 10 Mbps/1 Mbps, down only 4 percent from 2011.
  • 41 percent of Americans living on Tribal lands (1.6 million people) lack access to 25 Mbps/3 Mbps broadband
    • 68 percent living in rural areas of Tribal lands (1.3 million people) lack access.
  • 66 percent of Americans living in U.S. territories (2.6 million people) lack access to 25 Mbps/3 Mbps broadband.
    • 98 percent of those living in rural territorial areas (1.1 million people) lack access.
  • Americans living in rural and urban areas adopt broadband at similar rates where 25 Mbps/ 3 Mbps service is available, 28 percent in rural areas and 30 percent in urban areas.
  • While an increasing number of schools have high-speed connections, approximately 41 percent of schools, representing 47 percent of the nation’s students, lack the connectivity to meet the Commission’s short-term goal of 100 Mbps per 1,000 students/staff.

This Report concludes that more work needs to be done by the private and public sectors to expand robust broadband to all Americans in a timely way.  The FCC will continue working to accelerate broadband deployment and to remove barriers to infrastructure investment, in part by direct subsidies, and in part by identifying and helping to reduce potential obstacles to deployment, competition, and adop

What about the use of the Internet in Rural Areas?

President Donald J. Trump signed on Monday two orders aimed at improving internet speeds in some of the country’s hardest-to-connect areas, a move he described as “the first step to expand access to broadband internet in rural America.”

The first executive order aims to make it easier for internet service providers to locate broadband infrastructure on federal land and buildings in rural parts of the country. The order notes that one of the consequences of slow, expensive internet service is that it hinders schools’ ability to “enrich student learning with digital tools.”

I found these items after a long search. Many of these articles are lost to parents, communities and interested advocates. The news is full of other things. Maybe these groups have to advocate for education as the press does not usually share important information, like the Horizon Report, and ISTE Standards.

startup-photos.jpg


Parents and communities often have their own definition of what works in education and they may not be up to date on the reality of change within education. This report from the Civil Rights Commission probably is not seen by those without access to computers and technology.

An illustration picture shows projection of binary code on man holding aptop computer in Warsaw

An illustration picture shows a projection of binary code on a man holding a laptop computer, in an office in Warsaw June 24, 2013. REUTERS/Kacper Pempel

What do you know about Schools and the use of technology?What you know might be gated by the school or community in which you live and learn.

This is a briefing that should be shared by schools, parents, communities and school boards. Education-Inequity.pdf.

internet-of-things

There are a lot of people who do not have a problem with screen time. They have little access to technology. A new group is looking to find a way to use CRA funding to help the communities most impacted by lack of connectivity.

There are a lot of people who have a screen or two, but who do not use the technology effectively.

Sometimes there are programs funded within a community by groups trying to erase the digital divide.  HUD has a program that is supposed to help make the change. Connect Home.  What might be a group within your community that is trying to solve the problem?

Connect Home is a public-private collaboration to narrow the digital divide for families with school-age children who live in HUD-assisted housing.

Connect Home creates a platform for community leaders, local governments, nonprofit organizations, and private industry to join together and produce locally-tailored solutions for narrowing the digital divide. Through these stakeholders’ specific commitments to provide free or low-cost broadband access, devices, and digital literacy training, Connect Home extends affordable access to low-income families, ensuring that high-speed Internet follows our children from their classrooms back to their homes.

                                     How Connected is Your Community?

Here is a map to check your connectivity.

How are You Connected? ACCESS MAP

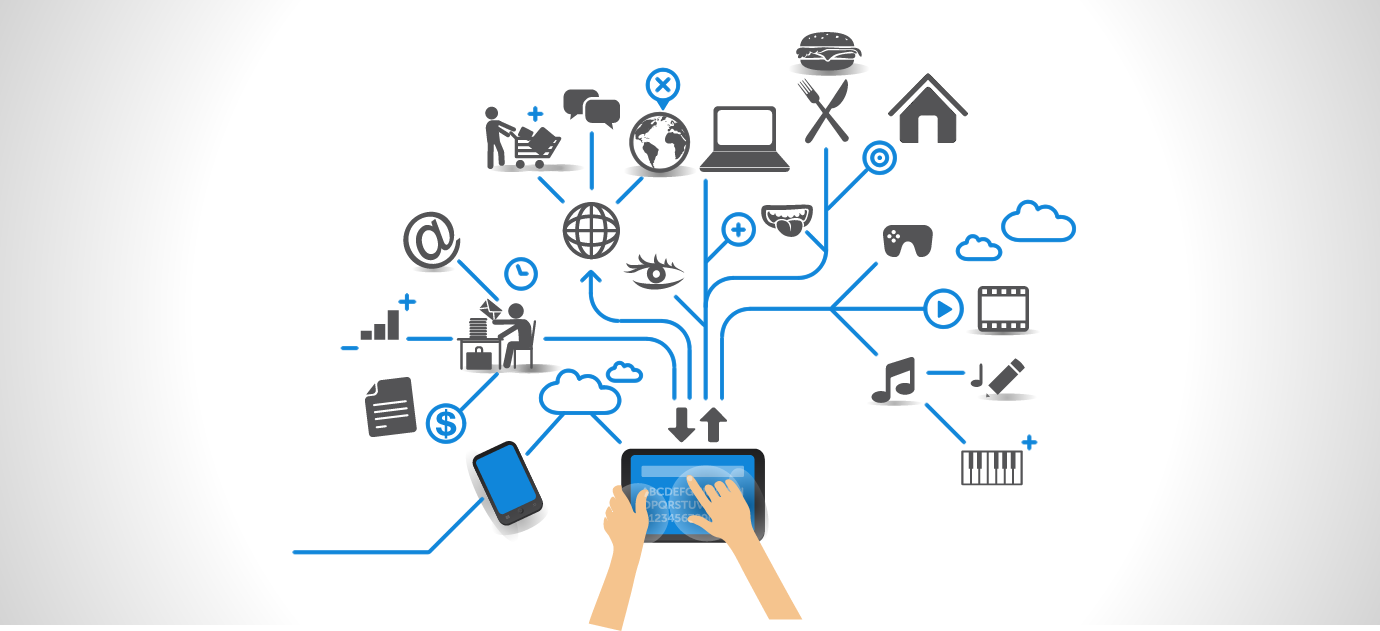
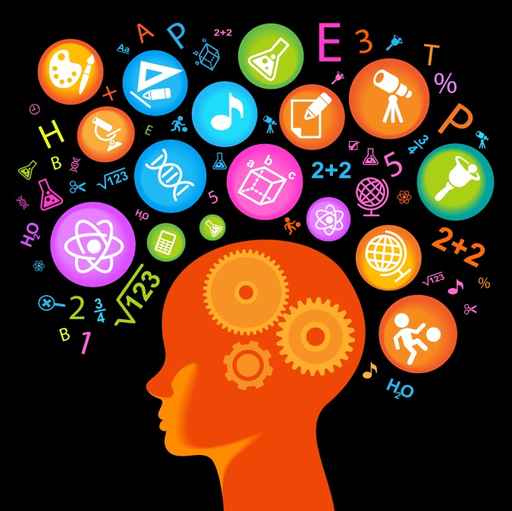
TECHNOLOGY HELPS US TO UNDERSTAND THE WORLD

pexels-photo-265672.png

STEM? There are free resources at Concord.org.

Groundbreaking and deeply digital learning
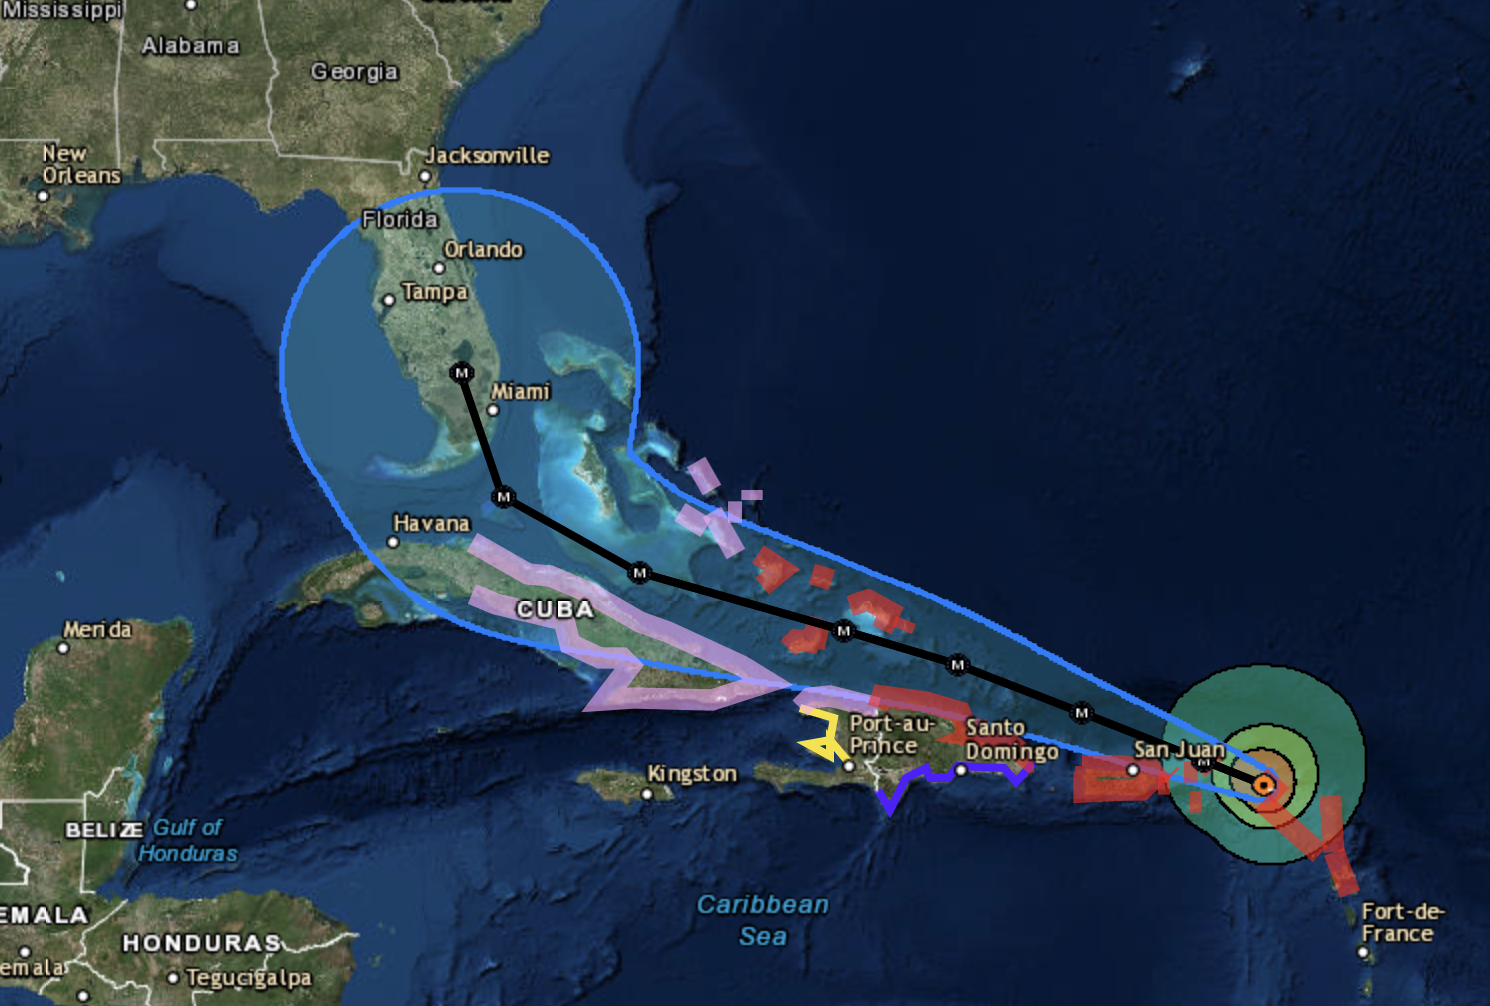
In recent months the use of technology has helped us to see disasters and to use big data to visualize.

This is an ESRI Story map of a weather event in the US.

Does your educational community take advantage of free resources, mentoring to schools and teachers in the ESRI Space?

Education ResourcesESRI Teacher Resources https://www.esri.com/en-us/industries/education/schools/educator-support
Hurricane-Irma-1054595

The Accidental Science of Cooking, as a part of Curriculum

I started a conversation while tearing through little bags of stuff from a Blue Apron package. At the time, I did not realize this service to be all that important. I cook. I had no idea that this service was so important to many.A friend let me have the remains of a package that she did not want. I was amused. The great thing was that there were small amounts of spices and condiments. But let me tell a story about cooking in the classroom and sharing the “Accidental Science of Cooking”internationally.

In November of 2002, I wrote a blog, and was invited to a Kid Screen Initiative.In Europe food , sources and preparation are taken very seriously.

I am what I eat , International Seminar as a speaker in Regione ,Lombardia ( Brescia) Italy

The organizer was Eva Schwarswald, throught the office of schools in Lombardy.

hot-dogs_720x480

I shared classroom experiences, Smithsonian garden resources from ” Seeds of Change” and recipes from my grandmother’s herbal medicine history.

In the presentation I  used resources from cultural  history , information from the book ” Spoonbread and Strawberry Wine, and the Accidental Science of Cooking at the Exploratorium.

One of my interests is in collecting  cookbooks and spices from all over the world. I have cooked in most countries and visited Farmer’s Markets, and local wineries as a part of my travel. I have been seen bringing olive oil, saffron and various spices home from trips around the world.

                        Precious Cargo: How Foods From the Americas Changed The World


21a-265s11


It is and was a hot topic.  Children’s Film, Media and Nutrition Education.

This was what I blogged about. http://www.exploratorium.edu/cooking/

School experiences , that is sharing family recipes and making a classroom cookbook are one of the projects we did in a classroom. I learned that if I used a matrix of cultural markers that I could justify adding cooking to the curriculum. Study a country? How and what do they eat. Study a region, what do they grow? What is sold in markets? What do people eat as a part of their daily life.

l learned to do this from the Smithsonian. They sent in a speaker to my classroom during the Cherry Blossom events. The lady came, demonstrated a kimono, had them do art, and at the same time she was cooking. She had their attention. So I learned to add cultural things to my curriculum.

Parents helped me out.When we made bread, that was an all day initiative, but we needed an oven to finish off the loaves.

A parent, Julie Mangis,helped me. She also taught me to create an awesome Gingerbread House lesson.. a little architecture for your holiday.

During the Halloween time, we learned about Curcubita.One plant group with the most species used as human food is the Cucurbitaceae family. Within this family, the genus Cucurbita stands out as one of the most important. Five of its species Cucurbita argyrosperma Huber, C. ficifolia Bouché, C. moschata (Duchesne ex Lam.) Duchesne ex Poiret, C. maxima Duchesne ex Poiret, and C. pepo L.—have been domesticated in the New World and for thousands of years they have been cultivated or at least handled by American societies. We talked the Native American way of growing corn, beans and squash. We found out why peanuts are called ground nuts. We roasted peanuts and pumpkin seeds. We put a bite in the curriculum.

Have you ever heard of a Pineapplelarium? People in England learned to create a way to grow pineapples in their climate.

Rare, exotic and hard to grow, Pineapples were a symbol of great status and wealth in Victorian times. A pineapple on your dining table meant you were a person of discernment, style and affluence.

At the The Lost Gardens of Heligan  in England , they believe that we have the only working, manure-heated pineapple pit in Britain today. It was unearthed in 1991 and architectural and horticultural historians spent many months researching the history of its construction and technology. The first structure here was probably built in the eighteenth century.

In many places in the South, Pineapples and exotic fruits and magnolia leaves were used to decorate the Christmas doors. We still do this in Alexandria, Virginia ( in the old mansions) and in Williamsburg, VA.


Food is something we deal with every day.  If I were in a classroom today, we would do ESRI story mapping. Where did the food come from and what stops did it make in getting to you. You may recall the National Geographic Lesson on a Chocolate Bar.

We are what we eat! From our ancestors throwing raw meat onto the fire for the first time to teams of lab technicians perfecting the crunch of a potato chip, it is a way to put STEAM into STEM. Interest into history.

What I learned in Europe is that school lunches are serious business and that Europeans spent a lot more money on food. I am sure that they would not approve of Blue Apron,but lots of my friends say that it is how a lot of young people learn to cook.I had HomeEc and my mother’s coaching. At least it is a way to share secrets of cooking.
When I taught in a very poor school I provided food for those who were hungry, but that’s another story.


GIS, Geoliteracy, and ESRI..What are you waiting for?

This year the changes in climate, the storms and devastation have caused us all to take time to pay attention to weather, to where places are and to what a disaster map is in many places. You should have also learned how and why storms are tracked.

People all of a sudden were worrying and watching the weatherman or a climate mapping system for news about fires, floods, the hurricanes. ESRI provided story maps and data for all to see. Problem? Many students  in the US do not study or use resources that are available free for schools.

During the Hurricane emergencies we could use this map.  There were individual story maps that you could use during the hurricanes, to learn to read, see , big data define the hurricane.Hurricane Harvey  , Hurricane Irma, Hurricane-Irma-1054595

Hurricane Maria

http://gis.ruekert-mielke.com/2017/09/14/esri-story-map-of-hurricane-harvey/

There were also story maps of the fires.

You can learn using ESRI resources.

What is a disaster that is likely to happen in your area? What is the history of weather in your area? What actions should you be ready to take?


iu

There are lots of fabulous tools that we can use to learn about Earth Science. One of my favorite is Science on a Sphere. You can learn about it here. SOS  There are lots of locations where you can go and participate in an SOS program. There is also SOS Lite. That is a download that you can install on your computer. Here is the link. SOS Lite.

Climate Models?

What Is a Climate Model?

Global climate models (GCMs) use math – a  lot of math – to describe how the atmosphere, the oceans, the land, living thingsice, and energy from the Sunaffect each other and Earth’s climate. Thousands of climate researchers use global climate models to better understand how global changes such as increasing greenhouses gases or decreasing Arctic sea ice will affect the Earth. The models are used to look hundreds of years into the future, so that we can predict how our planet’s climate will likely change.

There are various types of climate models. Some focus on certain things that affect climate such as the atmosphere or the oceans. Models that look at few variables of the climate systemmay be simple enough to run on a personal computer. Other models take into account many factors of the atmospherebiospheregeospherehydrosphere, and cryosphere to model the entire Earth system. They take into account the interactions and feedbacks between these different parts of the planet. Earth is a complex place and so many of these models are very complex too. They include so many math calculations that they must be run on supercomputers, which can do the calculations quickly. All climate models must make some assumptions about how the Earth works, but in general, the more complex a model, the more factors it takes into account, and the fewer assumptions it makes. At the National Center for Atmospheric Research (NCAR), researchers work with complex models of the Earth’s climate system. Their Community Climate System Model is so complex that it requires about three trillion math calculations to simulate a single day on planet Earth. It can take thousands of hours for the supercomputer to run the model. The model output, typically many gigabytes large, is analyzed by researchers and compared with other model results and with observations and measurement data.

NESTA  Souce

There are currently several other complex global climate models that are used to predict future climatic change. The most robust models are compared by the IPCC (Intergovernmental Panel on Climate Change) as they summarize predictions about future climate change.

There are tools that are used to predict weather and to define possibilities that are data models. There is a European Model, and a US Model which we learned from with all of the storms, and fires, in the last several months.

The European Climate Model

  • produces numerical weather forecasts and monitor the Earth-system;
  • carries out scientific and technical research to improve forecast skill;
  • maintains an archive of meteorological data.

To deliver this core mission, the Center provides:

  • twice-daily global numerical weather forecasts;
  • air quality analysis;
  • atmospheric composition monitoring;
  • climate monitoring;
  • ocean circulation analysis;
  • hydrological prediction.

They also provide advanced training to scientific staff in our Member and Co-operating States and assist the World Meteorological Organization with its programs. We make 25% of the supercomputing facilities available to Member States.

The US Climate Model is here.

https://www.climate.gov/teaching And you can look here

How reliable are computer models of the Earth’s climate?

Climate models are used to analyze past changes in the long-term averages and variations in temperature, precipitation, and other climate indicators, and to make projections of how these trends may change in the future. Today’s climate models do a good job at reproducing the broad features of the present climate and changes in climate, including the significant warming that has occurred over the last 50 years. Hence, climate models can be useful tools for measuring the changes in the factors that drive changes in climate, including heat-trapping gases, particulates from human and volcanic sources, and solar variability.

Scientists have amassed a vast body of knowledge regarding the physical world. However, unlike many areas of science, scientists who study the Earth’s climate cannot build a “control Earth” and conduct experiments on this Earth in a lab. To experiment with the Earth, scientists instead use this accumulated knowledge to build climate models, or “virtual Earths.” In studying climate change, these virtual Earths serve as an important way to integrate different kinds of knowledge of how the climate system works. These models can be used to test scientific understanding of the response of the Earth’s climate to past changes (such as the transition from the last glacial maximum to our current warm interglacial period) as well as to develop projections of future changes (such as the response of the Earth’s climate to human activities).

Climate models are based on mathematical and physical equations representing the fundamental laws of nature and the many processes that affect the Earth’s climate system. When the atmosphere, land, and ocean are divided up into small grid cells and these equations are applied to each grid cell, the models can capture the evolving patterns of atmospheric pressures, winds, temperatures, and precipitation. Over longer timeframes, these models simulate wind patterns, high and low pressure systems, and other weather characteristics that make up climate.

Some important physical processes are represented by approximate relationships because the processes are not fully understood, or they are at a scale that a model cannot directly represent. Examples include clouds, convection, and turbulent mixing of the atmosphere, for which important processes are much smaller than the resolution of current models. These approximations lead to uncertainties in model simulations of climate.

Climate models require enormous computing resources, especially to capture the geographical details of climate. Today’s most powerful supercomputers are enabling climate scientists to more thoroughly examine the effects of climate change in ways that were impossible just five years ago. Over the next decade, computer speeds are predicted to increase another 100 fold or more, permitting even more details of the climate system to be explored.

.Source

ucar_model_inputResources for schools.